Copyright
©The Author(s) 2024.
World J Diabetes. Feb 15, 2024; 15(2): 186-195
Published online Feb 15, 2024. doi: 10.4239/wjd.v15.i2.186
Published online Feb 15, 2024. doi: 10.4239/wjd.v15.i2.186
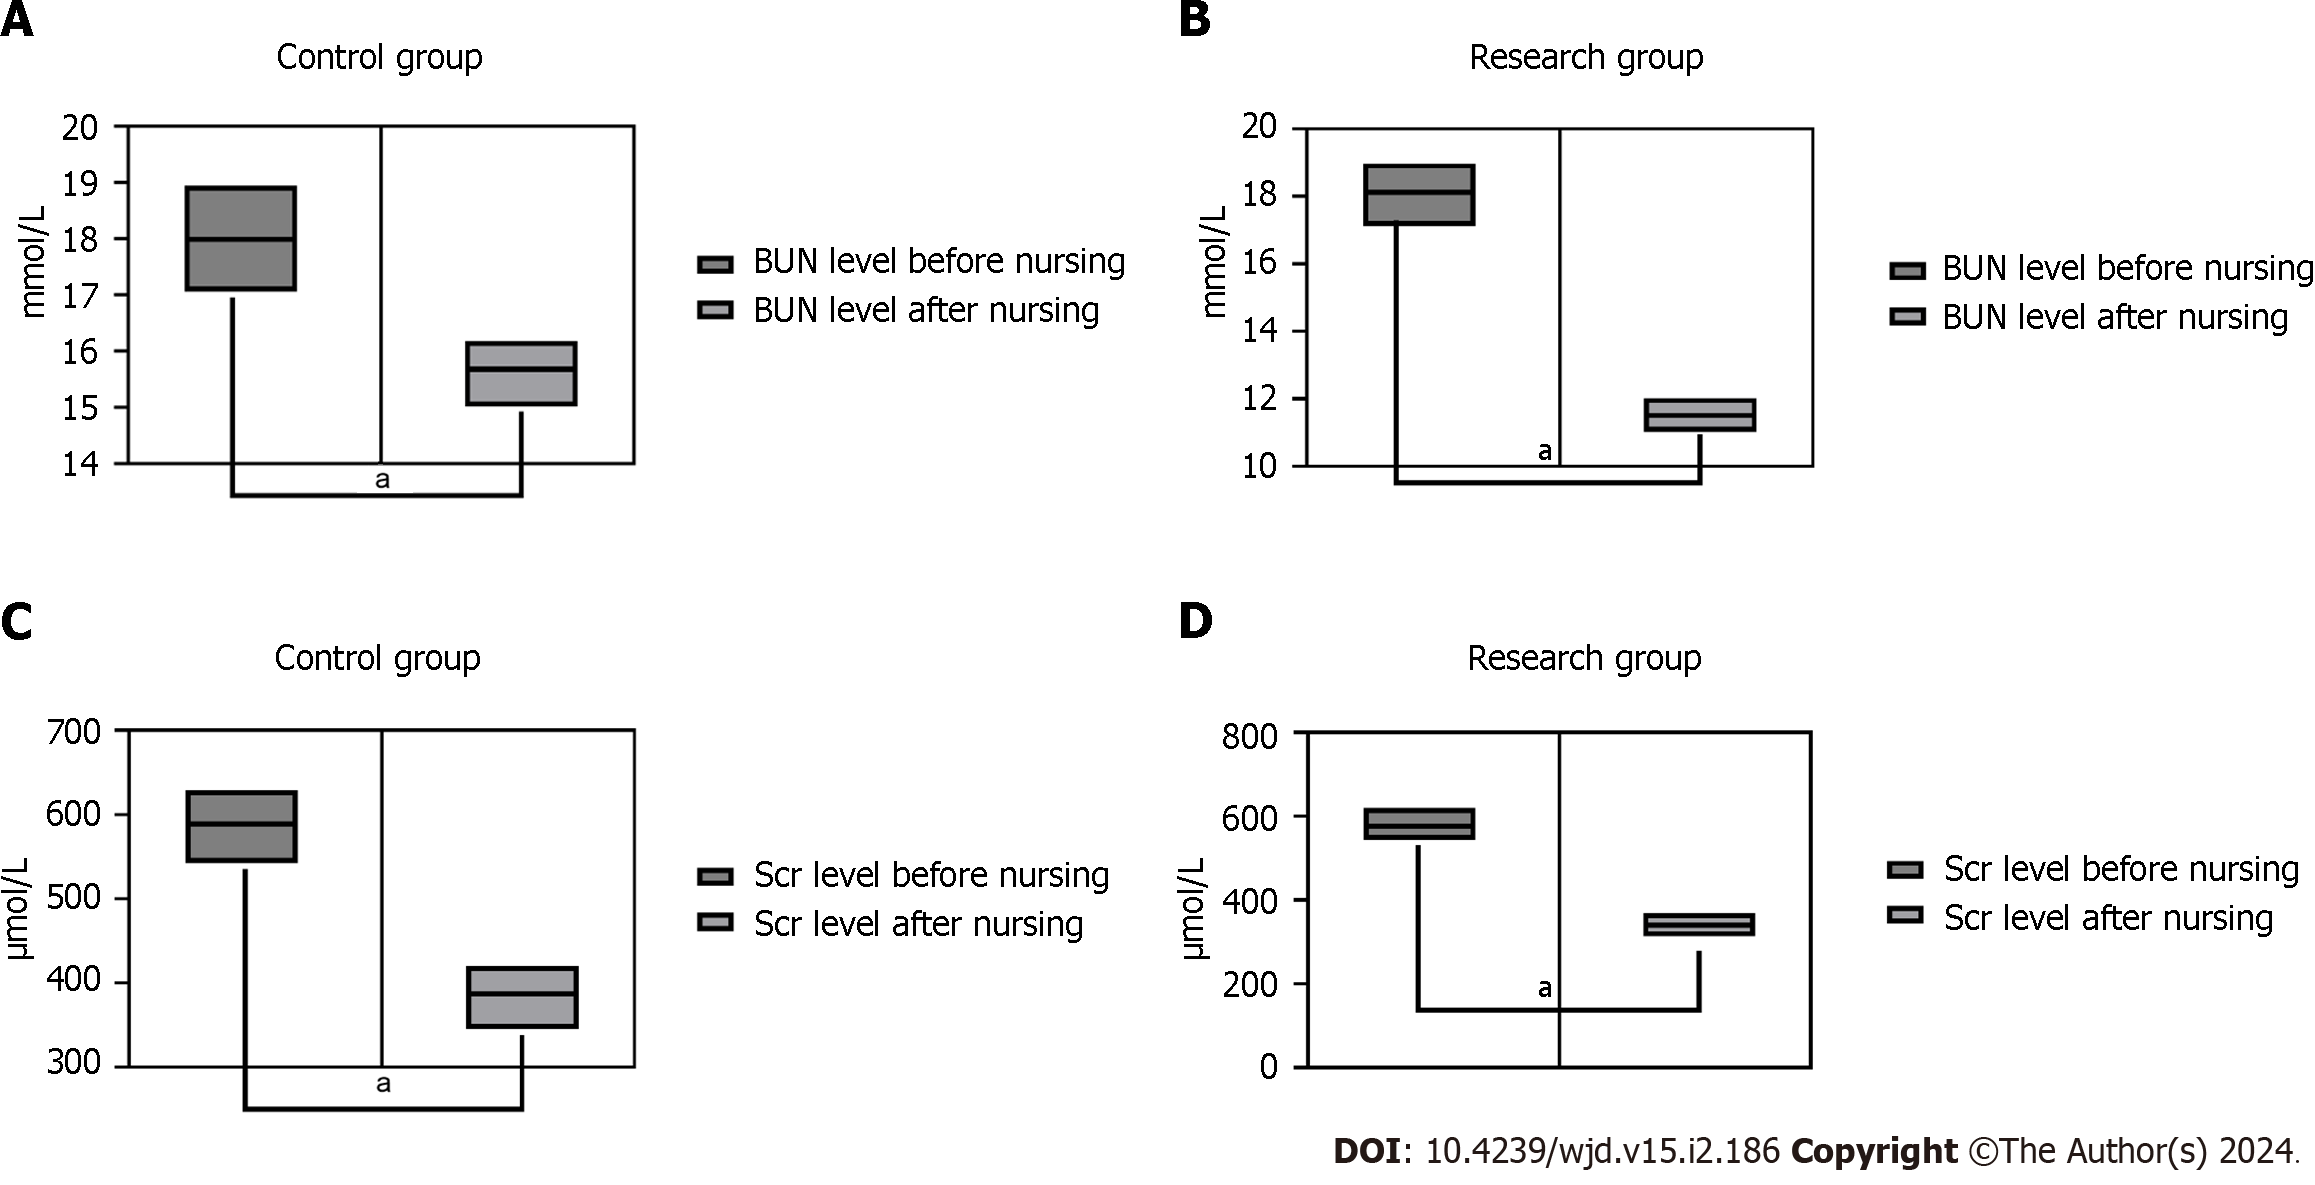
Figure 3 Comparative of renal function indicators.
A: Comparison of blood urea nitrogen (BUN) levels before and after treatment in control group; B: Comparison of BUN levels before and after treatment in the study group; C: Comparison of serum creatinine (SCr) level before and after treatment in control group; D: Comparison of SCr levels before and after treatment in the study group. aP < 0.05, the difference between groups with statistical significance.
- Citation: Chai XY, Bao XY, Dai Y, Dai XX, Zhang Y, Yang YL. Experience of humanistic nursing in hemodialysis nursing for patients with diabetic kidney disease. World J Diabetes 2024; 15(2): 186-195
- URL: https://www.wjgnet.com/1948-9358/full/v15/i2/186.htm
- DOI: https://dx.doi.org/10.4239/wjd.v15.i2.186


