
















©The Author(s) 2023.
World J Diabetes. Aug 15, 2023; 14(8): 1249-1258
Published online Aug 15, 2023. doi: 10.4239/wjd.v14.i8.1249
Published online Aug 15, 2023. doi: 10.4239/wjd.v14.i8.1249
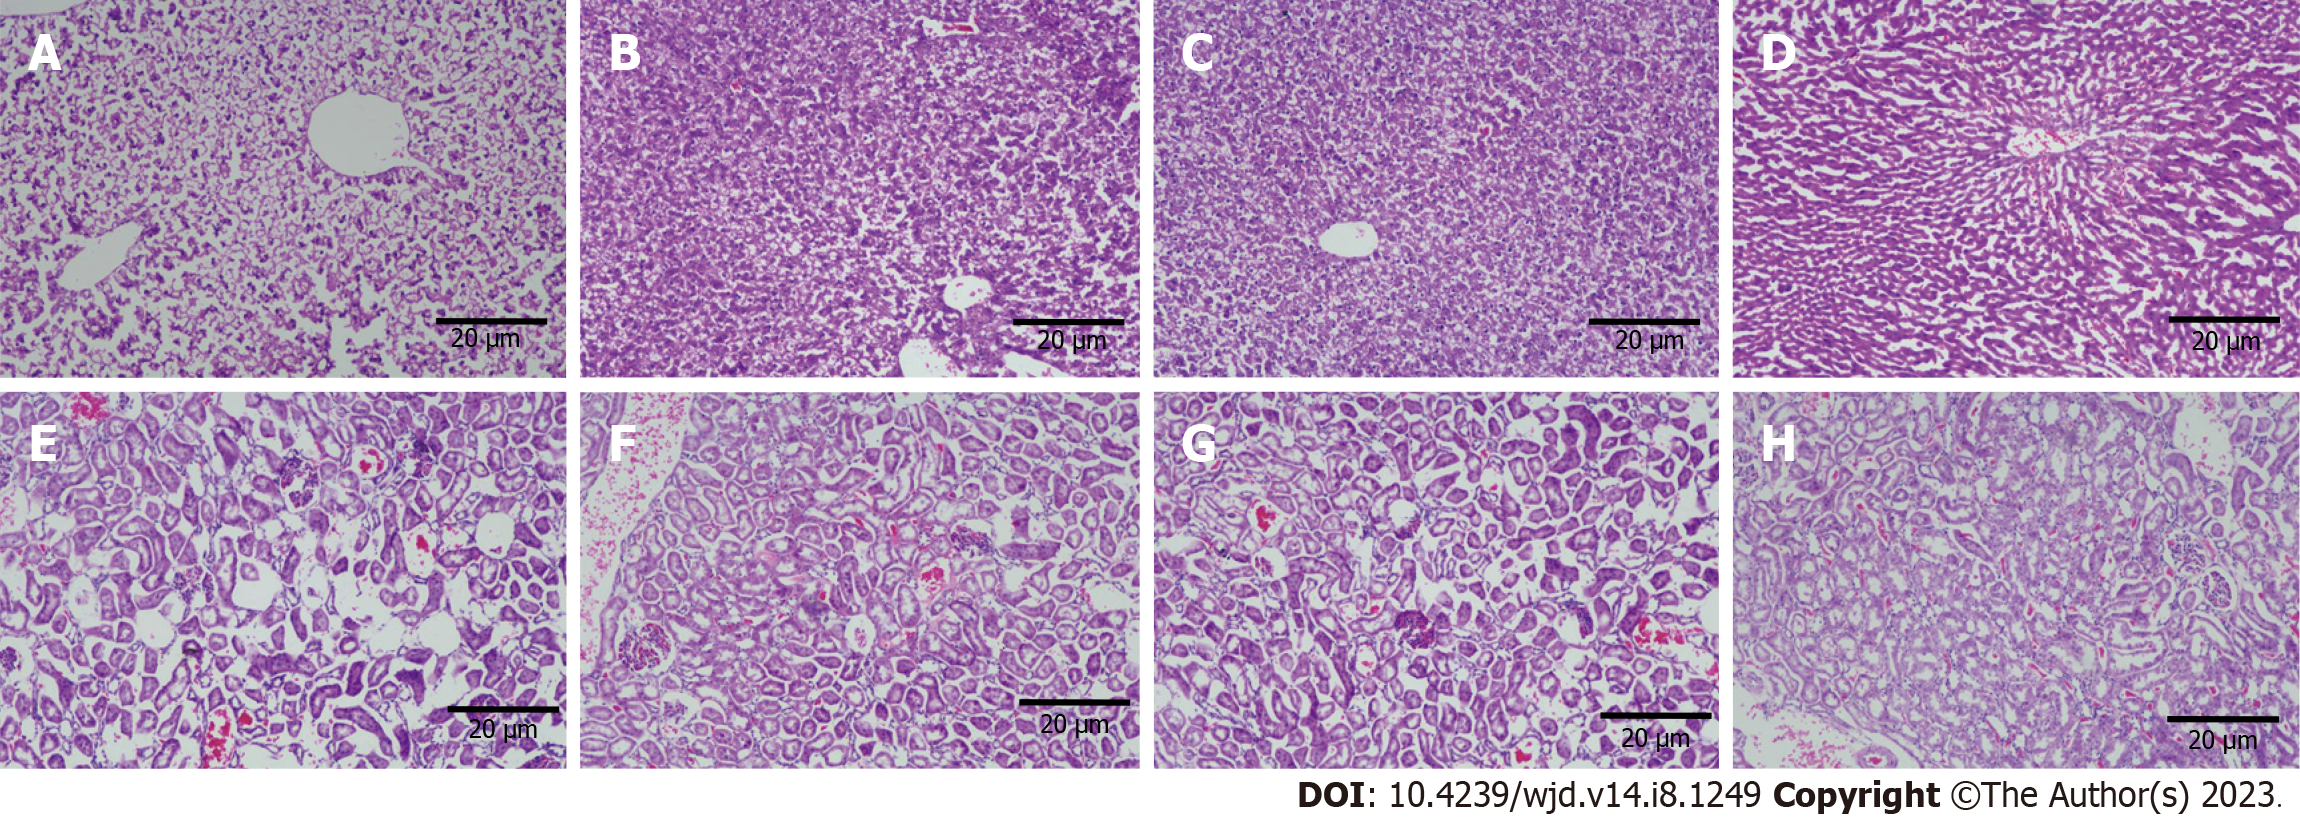
Figure 4 Histomorphological changes in the liver and kidneys.
A-H: Representative images of liver tissue in sham operation (SO) group (A), sleeve gastrectomy (SG) group (B), gastric banding (GB) group (C), and Roux-en-Y gastric bypass surgery (RYGB) group (D) in foodborne obese diabetic rats after bariatric surgery, as well as representative images of kidney tissue in SO group (E), SG group (F), GB group (G), and RYGB group (H) in foodborne obese diabetic rats after bariatric surgery are shown. Scale bars, 20 μm.
- Citation: Long H, Zhao L, Xiao ZS, Li SX, Huang QL, Xiao S, Wu LL. Impact of bariatric surgery on glucose and lipid metabolism and liver and kidney function in food-induced obese diabetic rats. World J Diabetes 2023; 14(8): 1249-1258
- URL: https://www.wjgnet.com/1948-9358/full/v14/i8/1249.htm
- DOI: https://dx.doi.org/10.4239/wjd.v14.i8.1249