Copyright
©The Author(s) 2023.
World J Diabetes. Jul 15, 2023; 14(7): 1112-1125
Published online Jul 15, 2023. doi: 10.4239/wjd.v14.i7.1112
Published online Jul 15, 2023. doi: 10.4239/wjd.v14.i7.1112
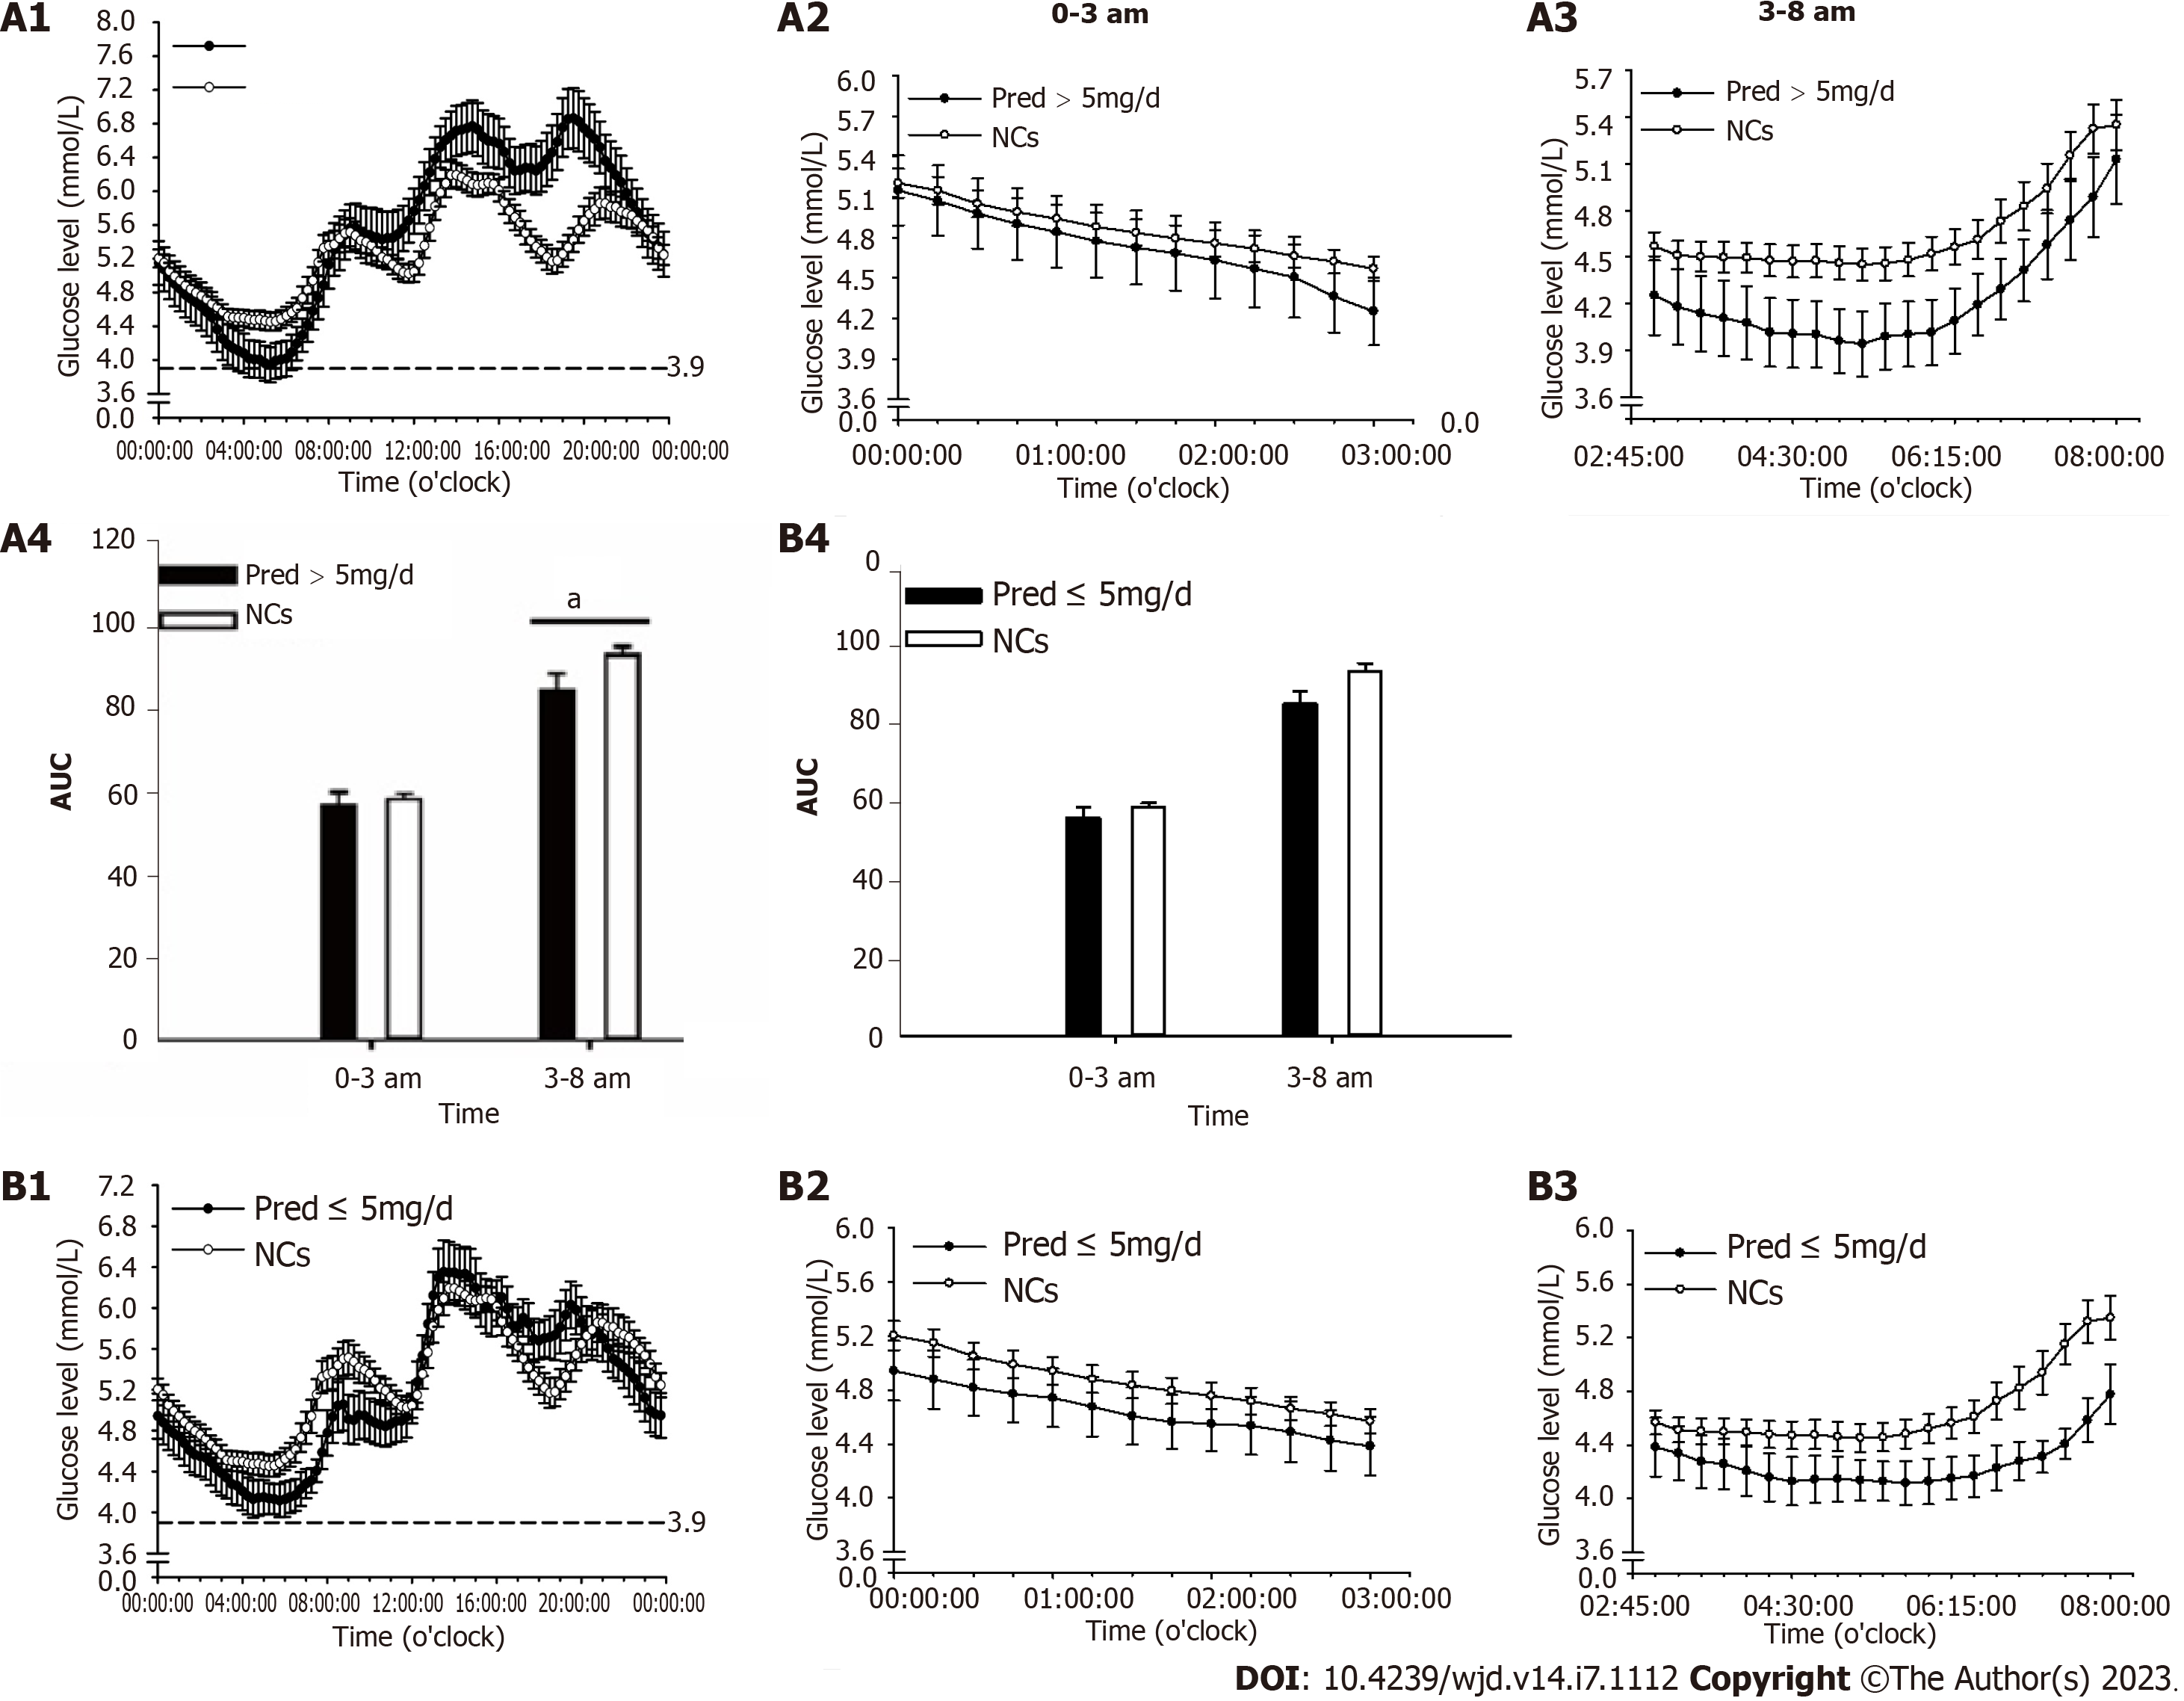
Figure 5 Glucose level and area under the curve during the day, at 0-3 am, period and at 3-8 am period.
Comparison of prednisone (Pred) > 5mg/d group to normal controls (NCs): A1, during the day; A2, at 0-3am; A3, at 3-8am; A4, AUC. Comparison of prednisone (Pred) ≤ 5mg/d group to normal controls (NCs): B1, during the day; B2, at 0-3am; B3, at 3-8am; B4, AUC. Data are denoted as mean ± SE. aP < 0.05. AUC: Area under the curve; NCs: Normal controls; Pred: Prednisone.
- Citation: Han MM, Zhang JX, Liu ZA, Xu LX, Bai T, Xiang CY, Zhang J, Lv DQ, Liu YF, Wei YH, Wu BF, Zhang Y, Liu YF. Glucose metabolism profile recorded by flash glucose monitoring system in patients with hypopituitarism during prednisone replacement. World J Diabetes 2023; 14(7): 1112-1125
- URL: https://www.wjgnet.com/1948-9358/full/v14/i7/1112.htm
- DOI: https://dx.doi.org/10.4239/wjd.v14.i7.1112


