Copyright
©The Author(s) 2022.
World J Diabetes. Sep 15, 2022; 13(9): 765-775
Published online Sep 15, 2022. doi: 10.4239/wjd.v13.i9.765
Published online Sep 15, 2022. doi: 10.4239/wjd.v13.i9.765
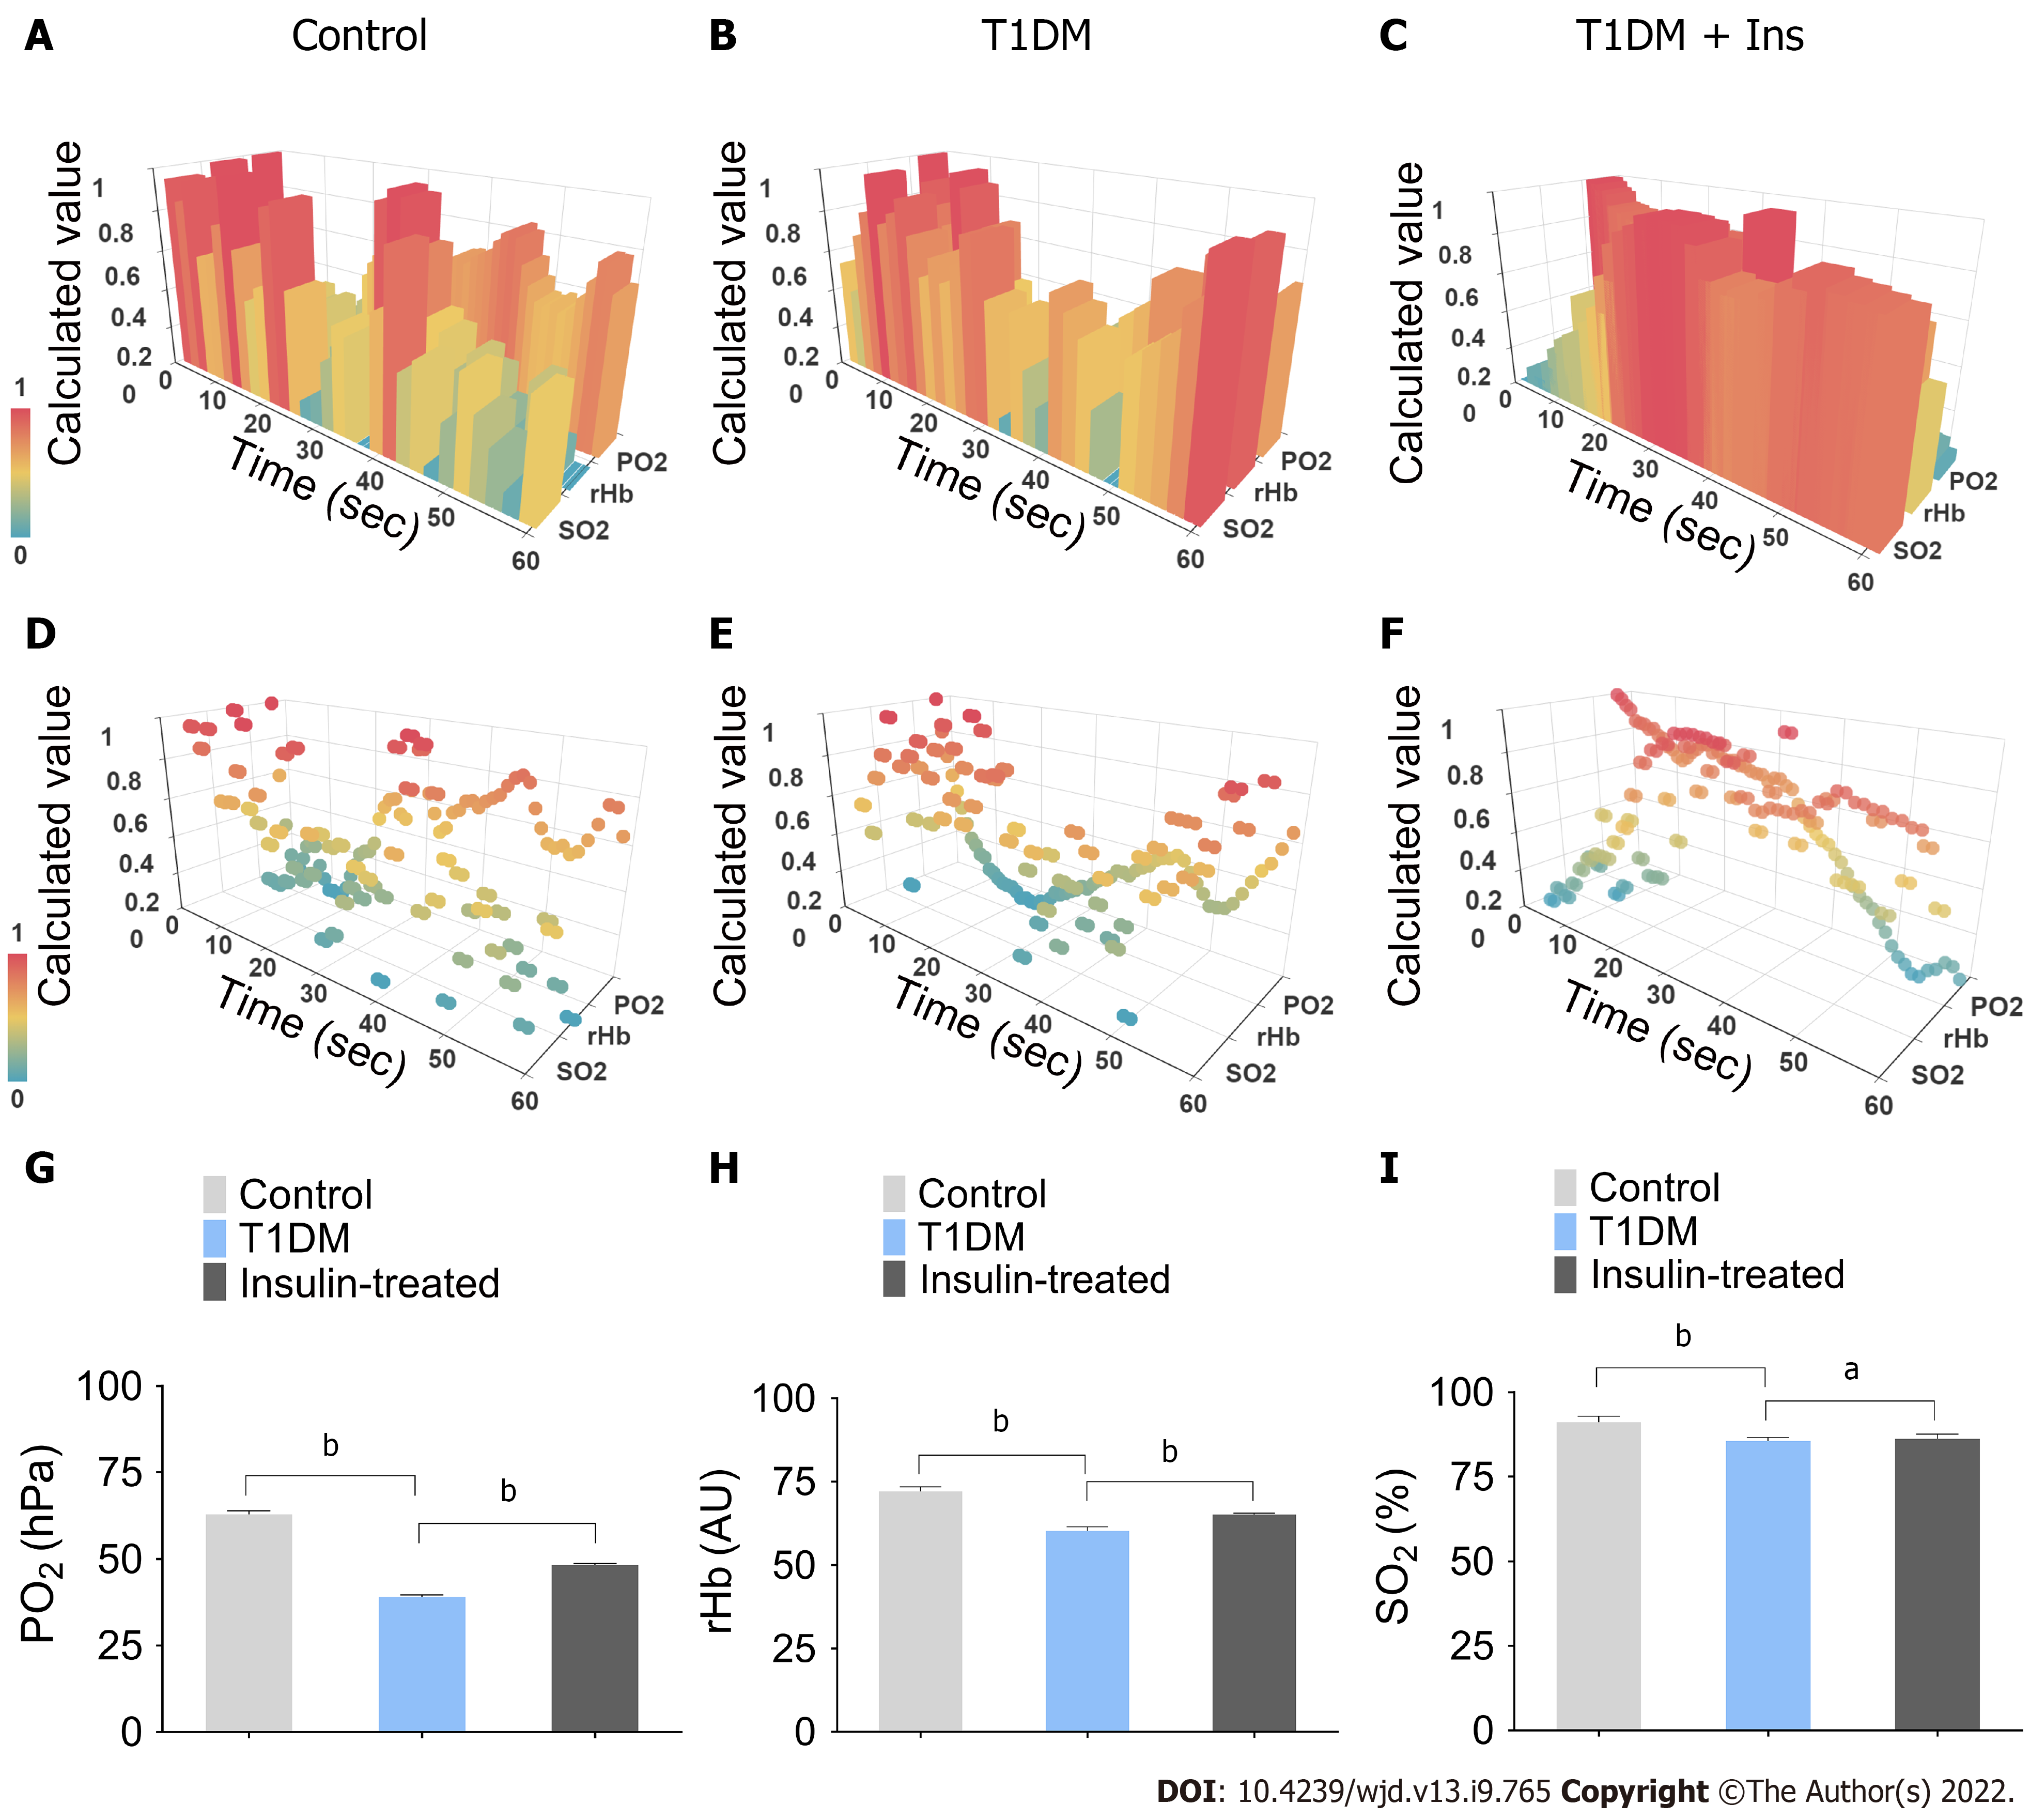
Figure 1 Integrated pancreatic microcirculatory oxygen profile.
A-F: The pancreatic microcirculatory oxygen parameters of control, type 1 diabetes mellitus (T1DM) and insulin-treated mice were captured by probes of O2C and Microx TX3. Python and Apache ECharts were used to generate and visualize the three-dimensional (3-D) module of the integrated pancreatic microcirculatory oxygen profile; G-I: Comparisons of pancreatic microcirculatory oxygen profiles among groups. Partial pressure of oxygen, relative amount of hemoglobin, and hemoglobin oxygen saturation levels in control and T1DM mice with or without insulin administration are illustrated. aP < 0.05, bP < 0.01. Control, control mice; T1DM, STZ-induced T1DM mice without insulin administration; Insulin-treated, STZ-induced diabetic mice with 1.5 IU administration. T1DM: type 1 diabetes mellitus; Ins: Insulin; SO2: Hemoglobin oxygen saturation; rHb: Relative amount of hemoglobin; PO2: Partial pressure of oxygen; O2C: Oxygen to See.
- Citation: Li BW, Li Y, Zhang X, Fu SJ, Wang B, Zhang XY, Liu XT, Wang Q, Li AL, Liu MM. Role of insulin in pancreatic microcirculatory oxygen profile and bioenergetics. World J Diabetes 2022; 13(9): 765-775
- URL: https://www.wjgnet.com/1948-9358/full/v13/i9/765.htm
- DOI: https://dx.doi.org/10.4239/wjd.v13.i9.765


