Copyright
©The Author(s) 2022.
World J Diabetes. Jun 15, 2022; 13(6): 454-465
Published online Jun 15, 2022. doi: 10.4239/wjd.v13.i6.454
Published online Jun 15, 2022. doi: 10.4239/wjd.v13.i6.454
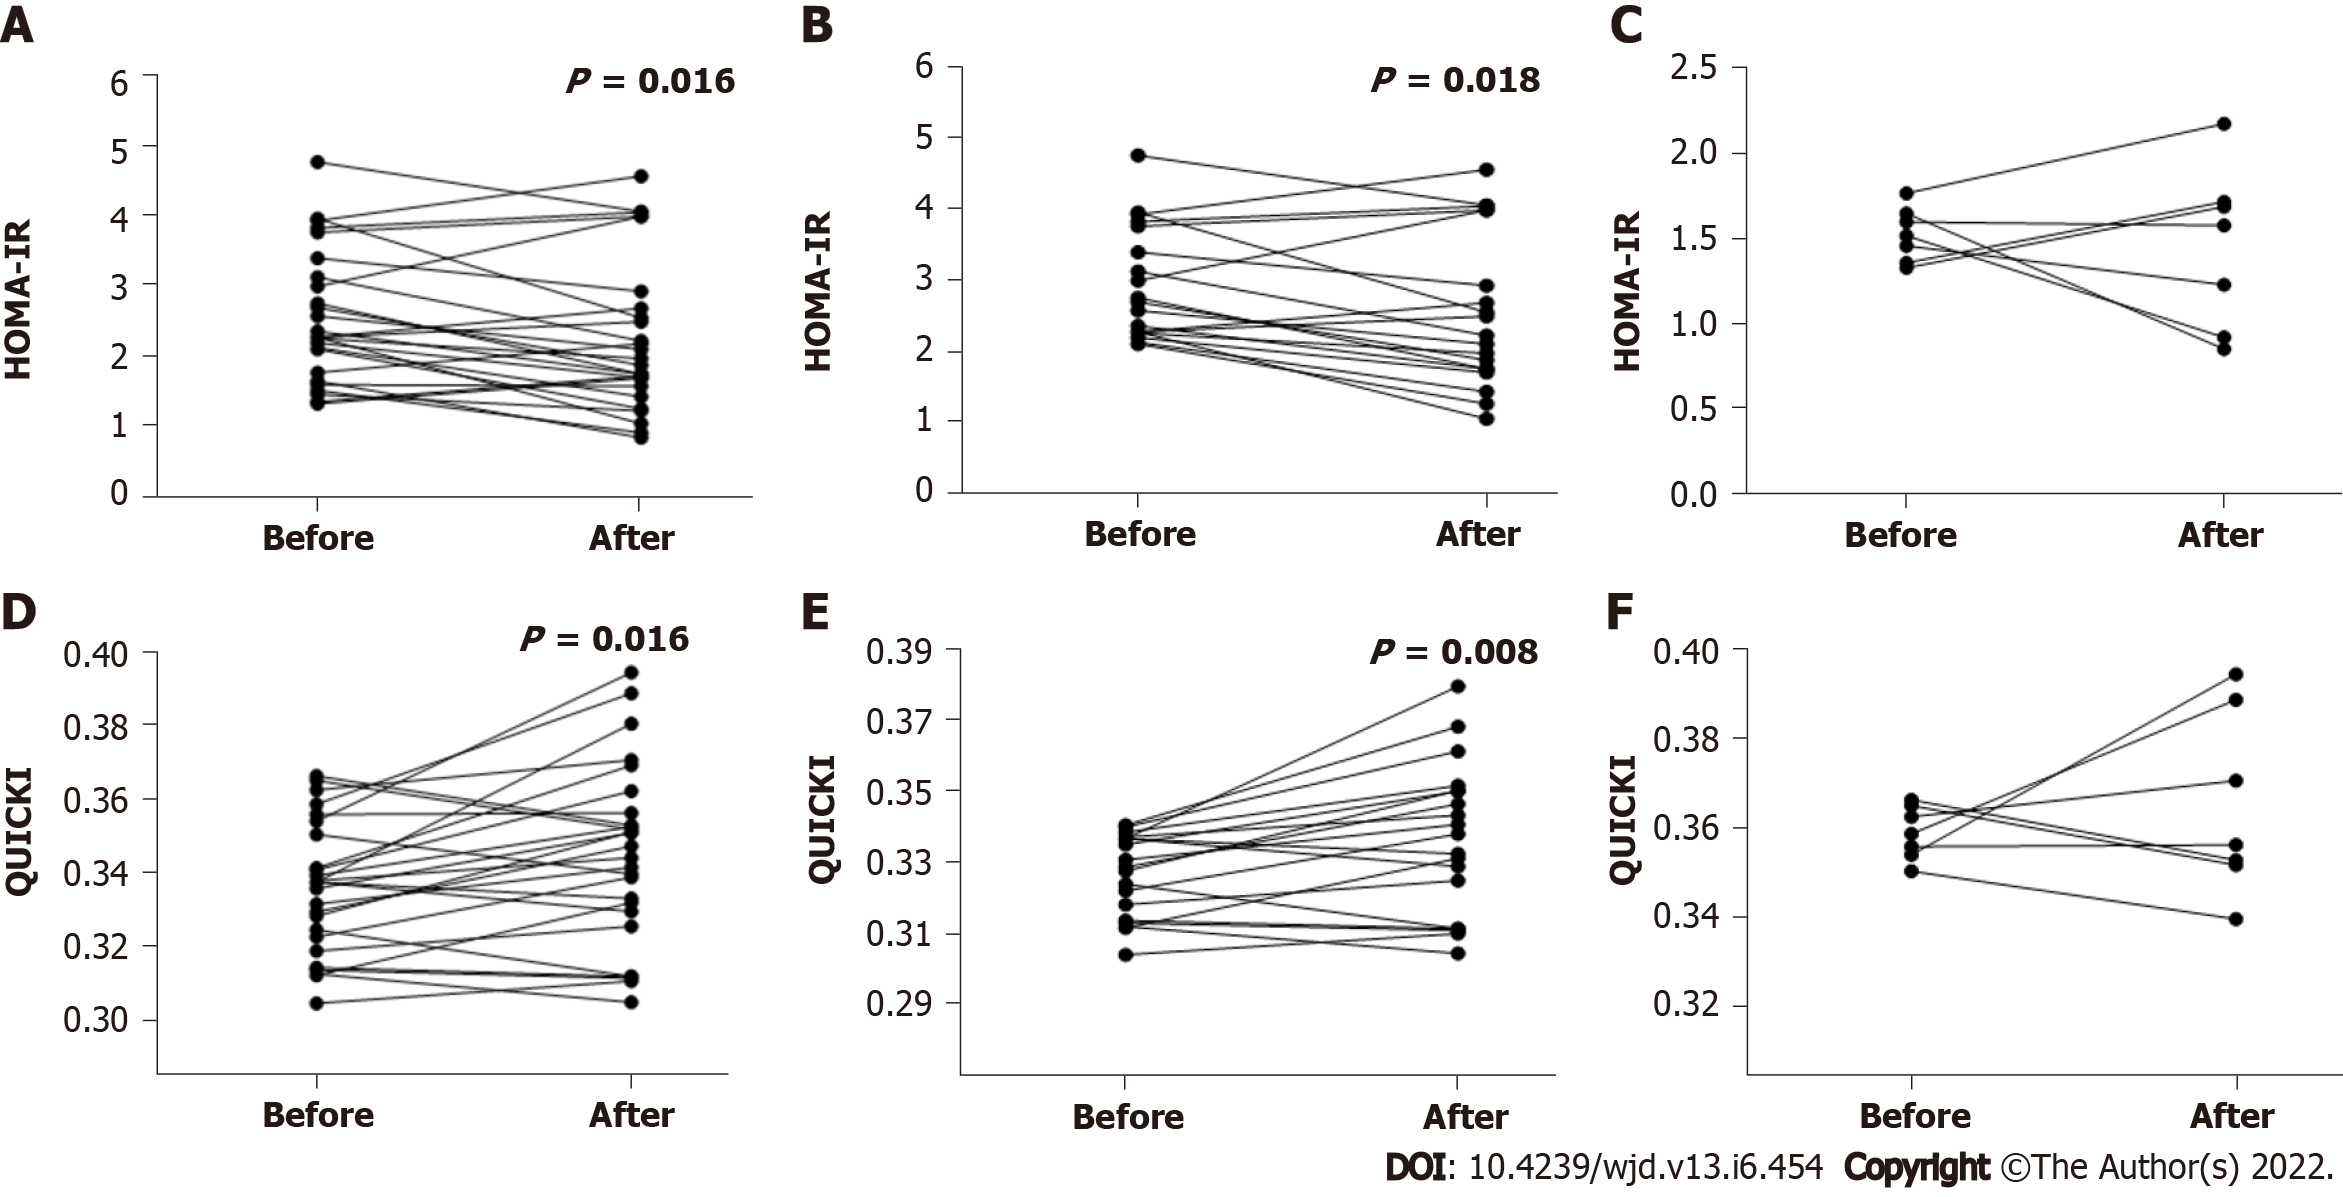
Figure 3 Homeostatic model assessment-insulin resistance and Quantitative Insulin Sensitivity Check Index levels in 26 active rheumatoid arthritis patients exposed to biologic agents before and 24 wk after tofacitinib therapy.
A: Homeostatic model assessment (HOMA)-insulin resistance (IR) levels in all 26 patients at weeks 0 and 24 after tofacitinib (TOF) therapy (P = 0.016); B: HOMA-IR levels in the high-IR group with 19 patients at weeks 0 and 24 after TOF therapy (P = 0.018); C: HOMA-IR levels in the low-IR group with 7 patients at weeks 0 and 24 after TOF therapy; D: Quantitative Insulin Sensitivity Check Index (QUICKI) levels in all 26 patients at weeks 0 and 24 after TOF therapy (P = 0.016); E: QUICKI levels in the high-IR group with 19 patients at weeks 0 and 24 after TOF therapy (P = 0.008); F: QUICKI levels in the low-IR group with 7 patients at weeks 0 and 24 after TOF therapy. QUICKI: Quantitative Insulin Sensitivity Check Index; HOMA-TR: Homeostatic model assessment-insulin resistance.
- Citation: Wang CR, Tsai HW. Immediate-release tofacitinib reduces insulin resistance in non-diabetic active rheumatoid arthritis patients: A single-center retrospective study. World J Diabetes 2022; 13(6): 454-465
- URL: https://www.wjgnet.com/1948-9358/full/v13/i6/454.htm
- DOI: https://dx.doi.org/10.4239/wjd.v13.i6.454


