
















©The Author(s) 2022.
World J Diabetes. Feb 15, 2022; 13(2): 97-109
Published online Feb 15, 2022. doi: 10.4239/wjd.v13.i2.97
Published online Feb 15, 2022. doi: 10.4239/wjd.v13.i2.97
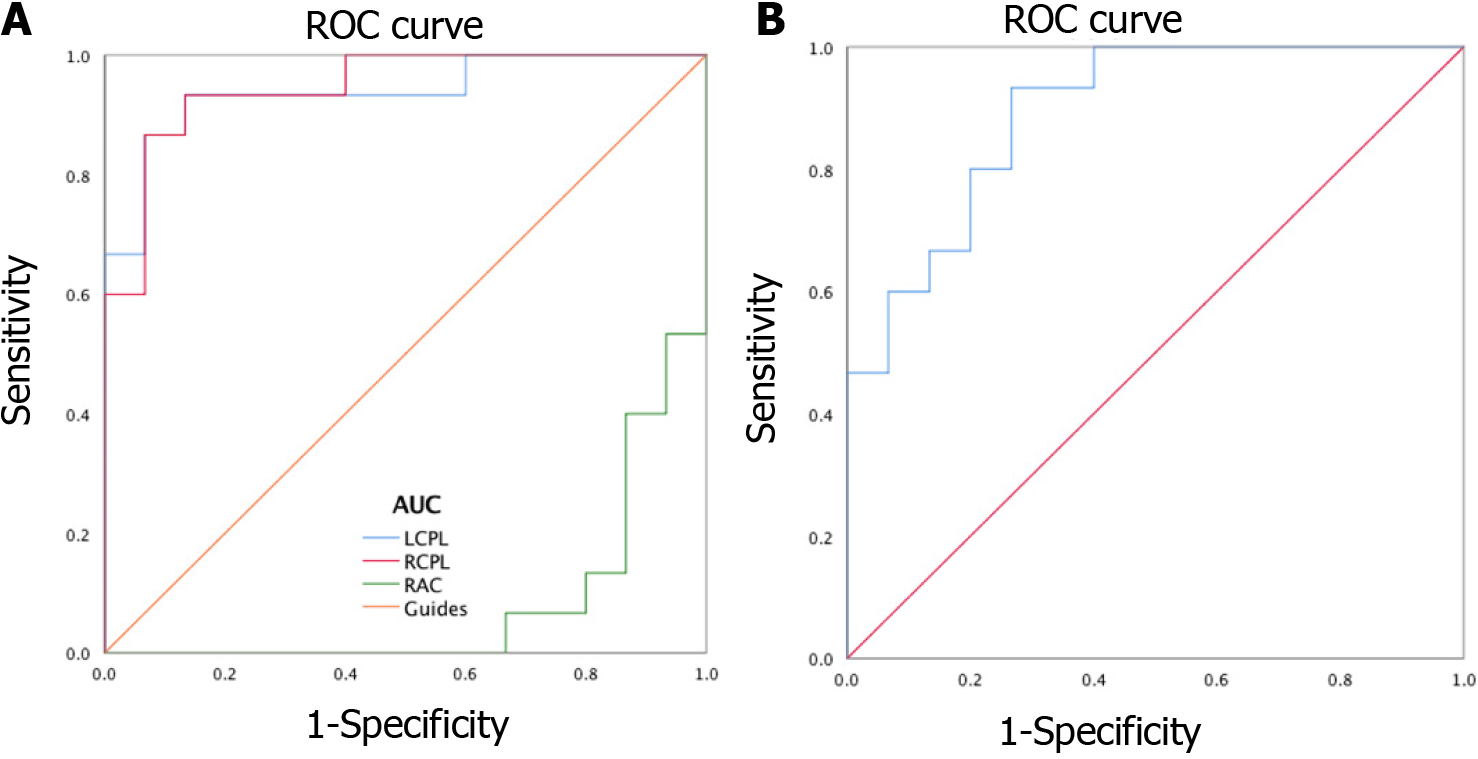
Figure 4 Receiver operating characteristic curve analysis of the mean amplitude of low-frequency fluctuation values for altered brain regions.
A: The area under the ROC curve were 0.080, [P < 0.001; 95% confidence interval (CI): 0.000 to 0.177] for RAC, LCPL 0.938 (P < 0.001; 95%CI: 0.849 to 1.000), RCPL 0.947 (P < 0.001; 95%CI: 0.871 to 1.000) [diabetic retinopathies (DRs) > healthy controls (HCs)]; B: The area under the ROC curve were 0.893 (P < 0.001; 95%CI: 0.782 to 1.000) for BC (DRs < HCs). ROC: Receiver operating characteristic; AUC: Area under the curve; LCPL: Left cerebellum posterior lobe; RCPL: Right cerebellum posterior lobe; RAC: Right anterior cingulate.
- Citation: Shi WQ, Zhang MX, Tang LY, Ye L, Zhang YQ, Lin Q, Li B, Shao Y, Yu Y. Altered spontaneous brain activity patterns in patients with diabetic retinopathy using amplitude of low-frequency fluctuation. World J Diabetes 2022; 13(2): 97-109
- URL: https://www.wjgnet.com/1948-9358/full/v13/i2/97.htm
- DOI: https://dx.doi.org/10.4239/wjd.v13.i2.97