Copyright
©The Author(s) 2022.
World J Diabetes. Feb 15, 2022; 13(2): 97-109
Published online Feb 15, 2022. doi: 10.4239/wjd.v13.i2.97
Published online Feb 15, 2022. doi: 10.4239/wjd.v13.i2.97
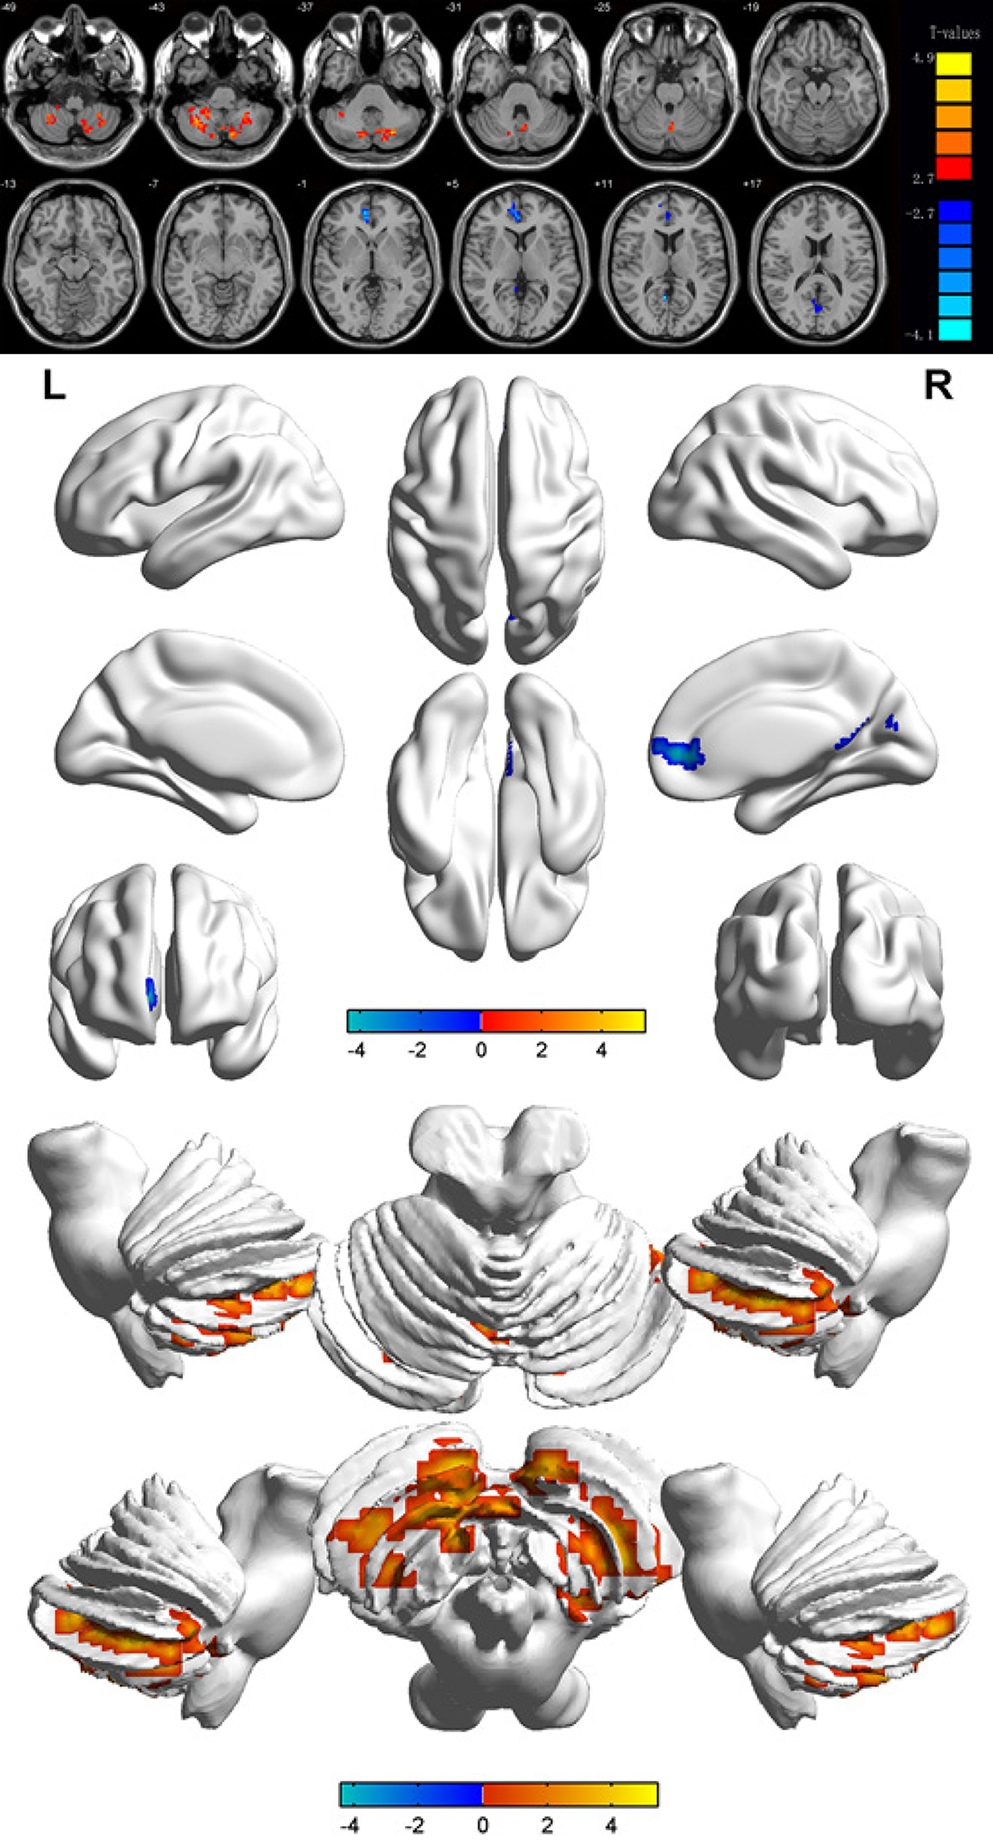
Figure 2 Significant differences in spontaneous brain activity between the diabetic retinopathy group and healthy controls.
The different brain regions were observed in the left cerebellum posterior lobe, right cerebellum posterior lobe, right anterior cingulate and bilateral calcarine. The red areas denote higher amplitude of low-frequency fluctuation (ALFF) brain regions, and the blue areas denote lower ALFF brain regions [P < 0.001 for multiple comparisons using Gaussian random field theory (z.2.3, P < 0.01, cluster > 30 voxels, Alphasim corrected)].
- Citation: Shi WQ, Zhang MX, Tang LY, Ye L, Zhang YQ, Lin Q, Li B, Shao Y, Yu Y. Altered spontaneous brain activity patterns in patients with diabetic retinopathy using amplitude of low-frequency fluctuation. World J Diabetes 2022; 13(2): 97-109
- URL: https://www.wjgnet.com/1948-9358/full/v13/i2/97.htm
- DOI: https://dx.doi.org/10.4239/wjd.v13.i2.97


