Copyright
©The Author(s) 2021.
World J Diabetes. Apr 15, 2021; 12(4): 499-513
Published online Apr 15, 2021. doi: 10.4239/wjd.v12.i4.499
Published online Apr 15, 2021. doi: 10.4239/wjd.v12.i4.499
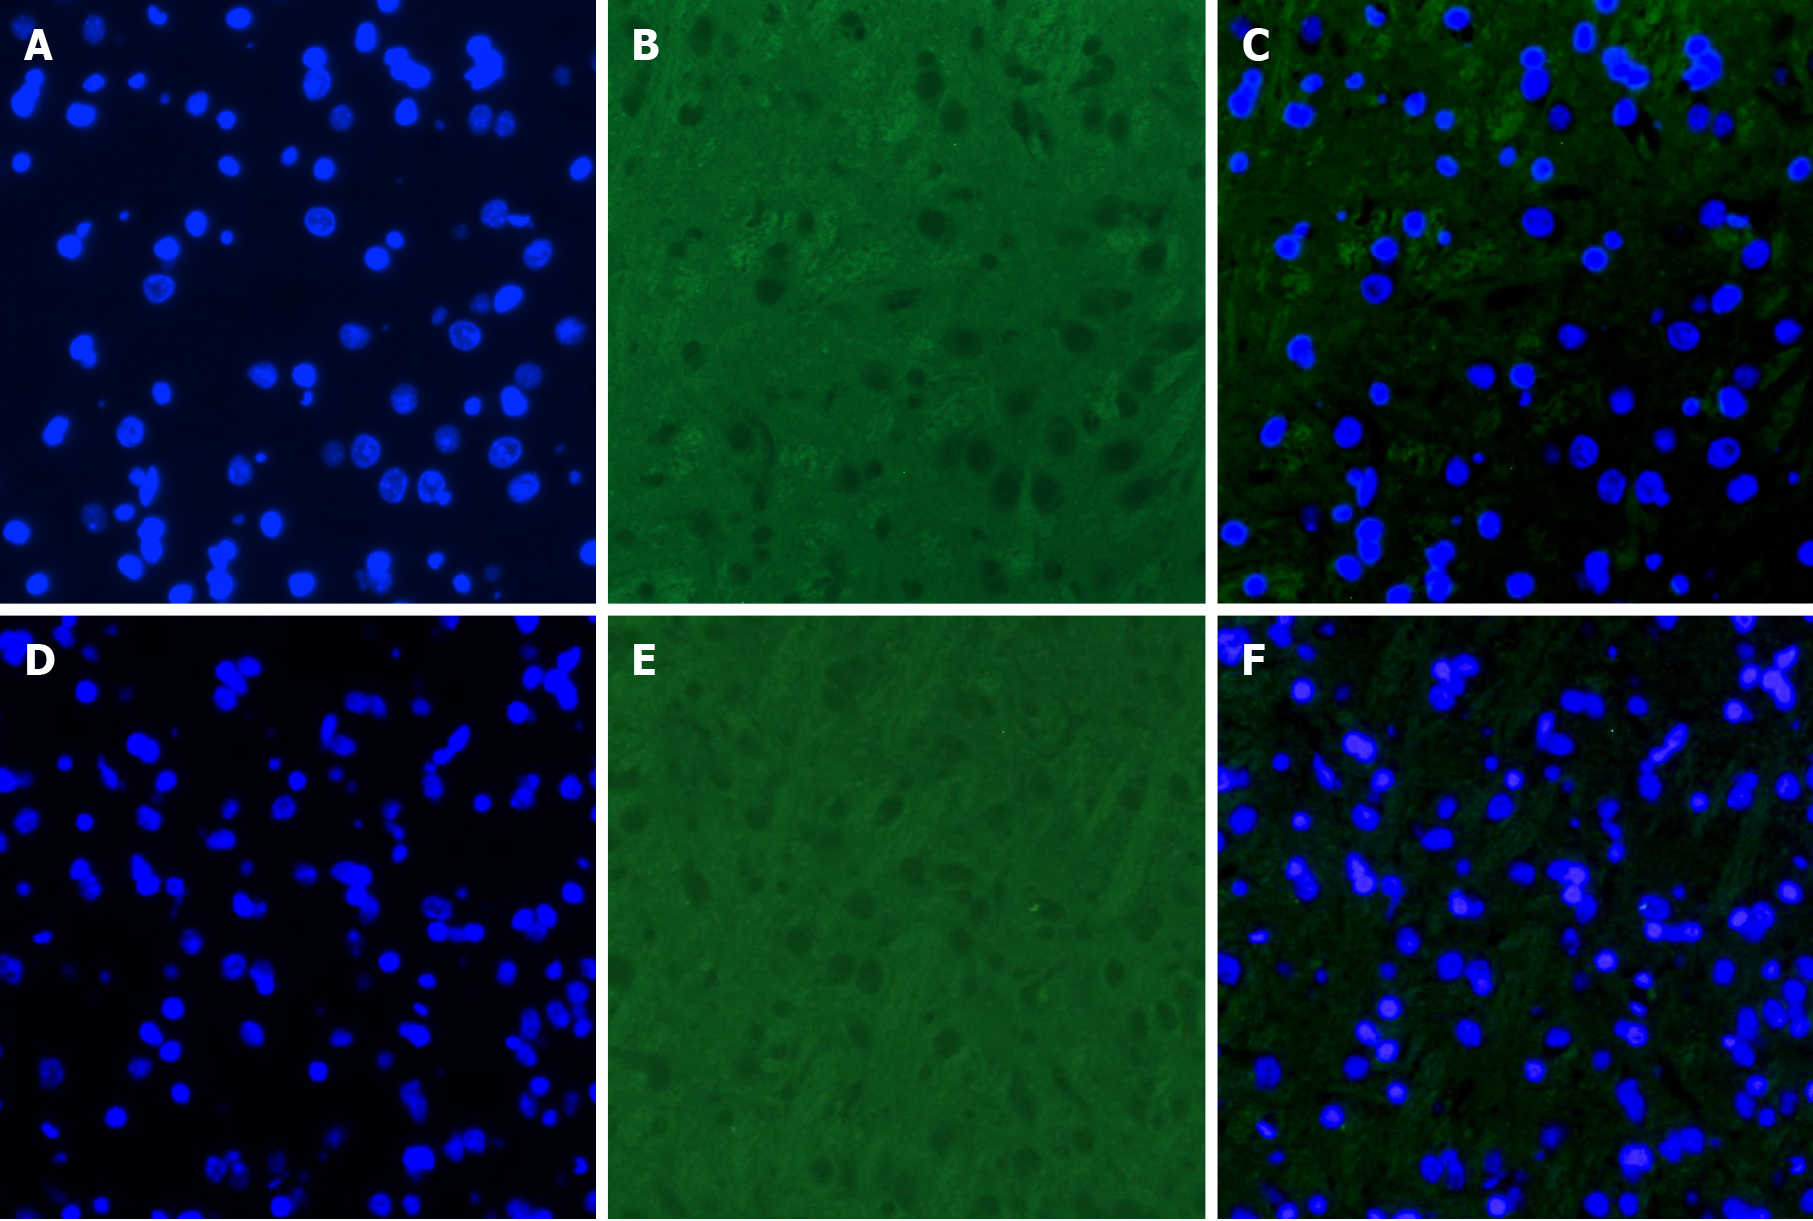
Figure 4 Images of vascular endothelial growth factor immunofluorescence staining of the hippocampus in each group.
A: Nucleus in the type 2 diabetes mellitus group (blue); B: Vascular endothelial growth factor levels in the type 2 diabetes mellitus group (green); C: Merged image for the type 2 diabetes mellitus group; D: Nucleus in the control group (blue); E: Vascular endothelial growth factor levels in the control group (green); F: Merged image for the control group. Scale bar, 100 µm.
- Citation: Shao JW, Wang JD, He Q, Yang Y, Zou YY, Su W, Xiang ST, Li JB, Fang J. Three-dimensional-arterial spin labeling perfusion correlation with diabetes-associated cognitive dysfunction and vascular endothelial growth factor in type 2 diabetes mellitus rat. World J Diabetes 2021; 12(4): 499-513
- URL: https://www.wjgnet.com/1948-9358/full/v12/i4/499.htm
- DOI: https://dx.doi.org/10.4239/wjd.v12.i4.499


