Copyright
©The Author(s) 2021.
World J Diabetes. Dec 15, 2021; 12(12): 2058-2072
Published online Dec 15, 2021. doi: 10.4239/wjd.v12.i12.2058
Published online Dec 15, 2021. doi: 10.4239/wjd.v12.i12.2058
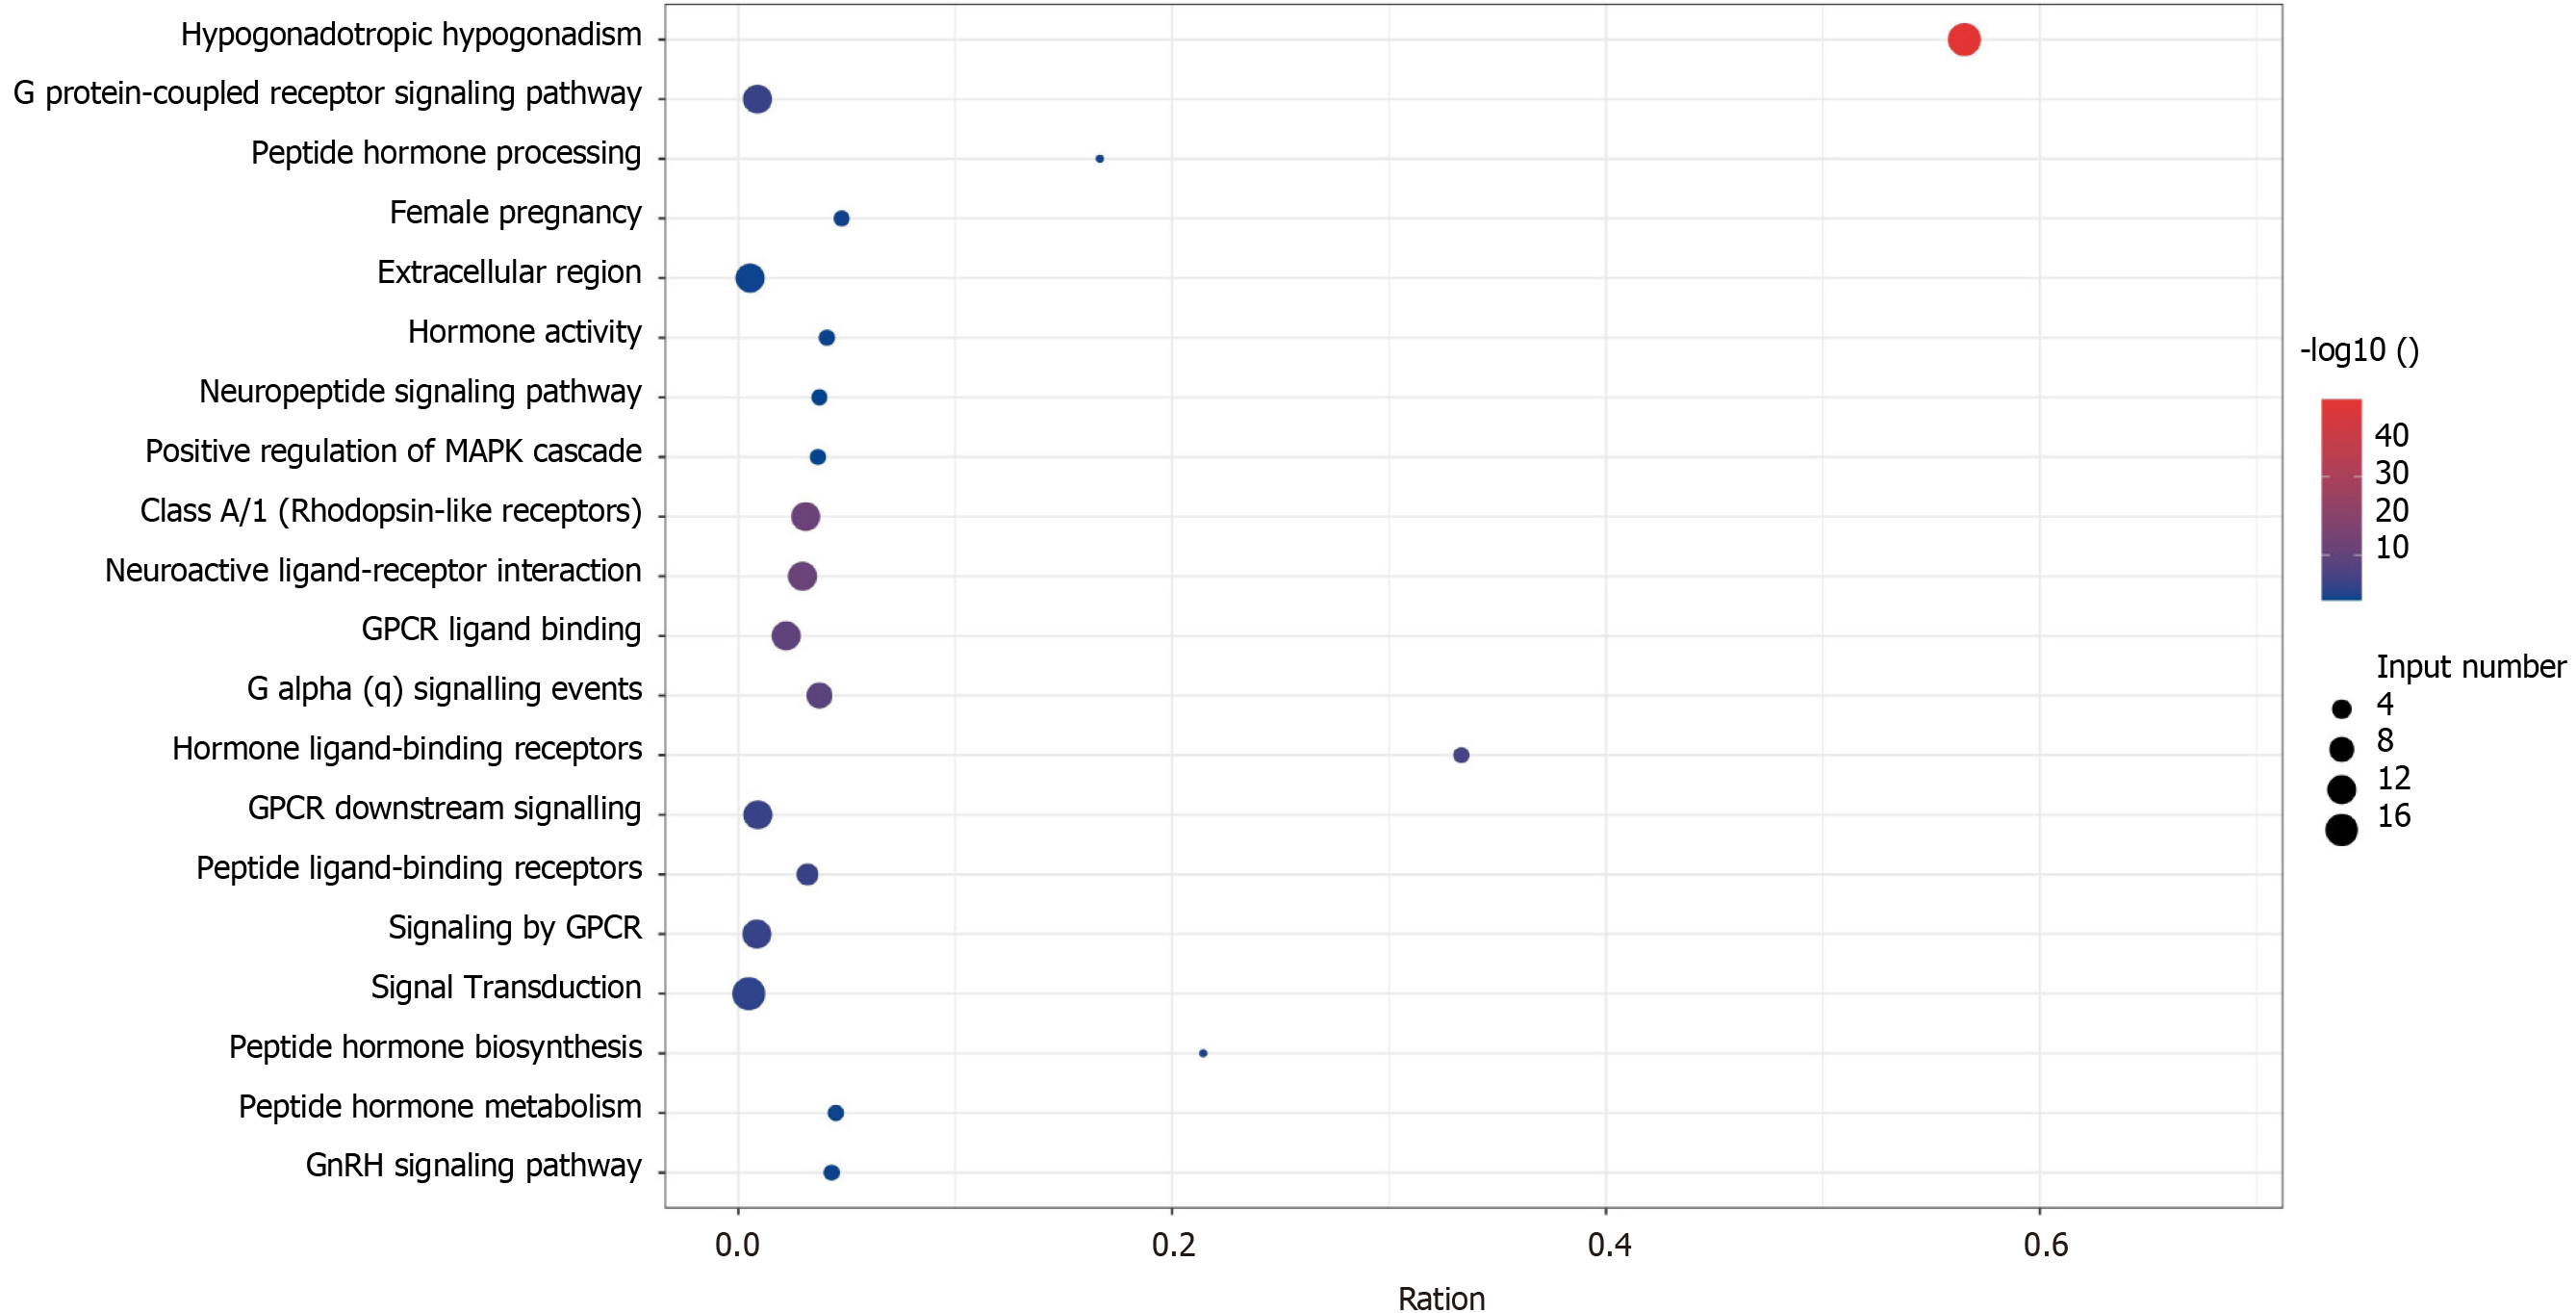
Figure 3 Normosmic hypogonadotropic hypogonadism pathogenic gene enrichment pathway and gene ontology, the x-axis represents gene ratio, and the y-axis represents gene ontology term; the size of the dot represents the number of genes, and the color of the dot represents the level of P value.
- Citation: Sun SS, Wang RX. Molecular diagnosis of Kallmann syndrome with diabetes by whole exome sequencing and bioinformatic approaches. World J Diabetes 2021; 12(12): 2058-2072
- URL: https://www.wjgnet.com/1948-9358/full/v12/i12/2058.htm
- DOI: https://dx.doi.org/10.4239/wjd.v12.i12.2058


