Copyright
©The Author(s) 2021.
World J Diabetes. Nov 15, 2021; 12(11): 1917-1927
Published online Nov 15, 2021. doi: 10.4239/wjd.v12.i11.1917
Published online Nov 15, 2021. doi: 10.4239/wjd.v12.i11.1917
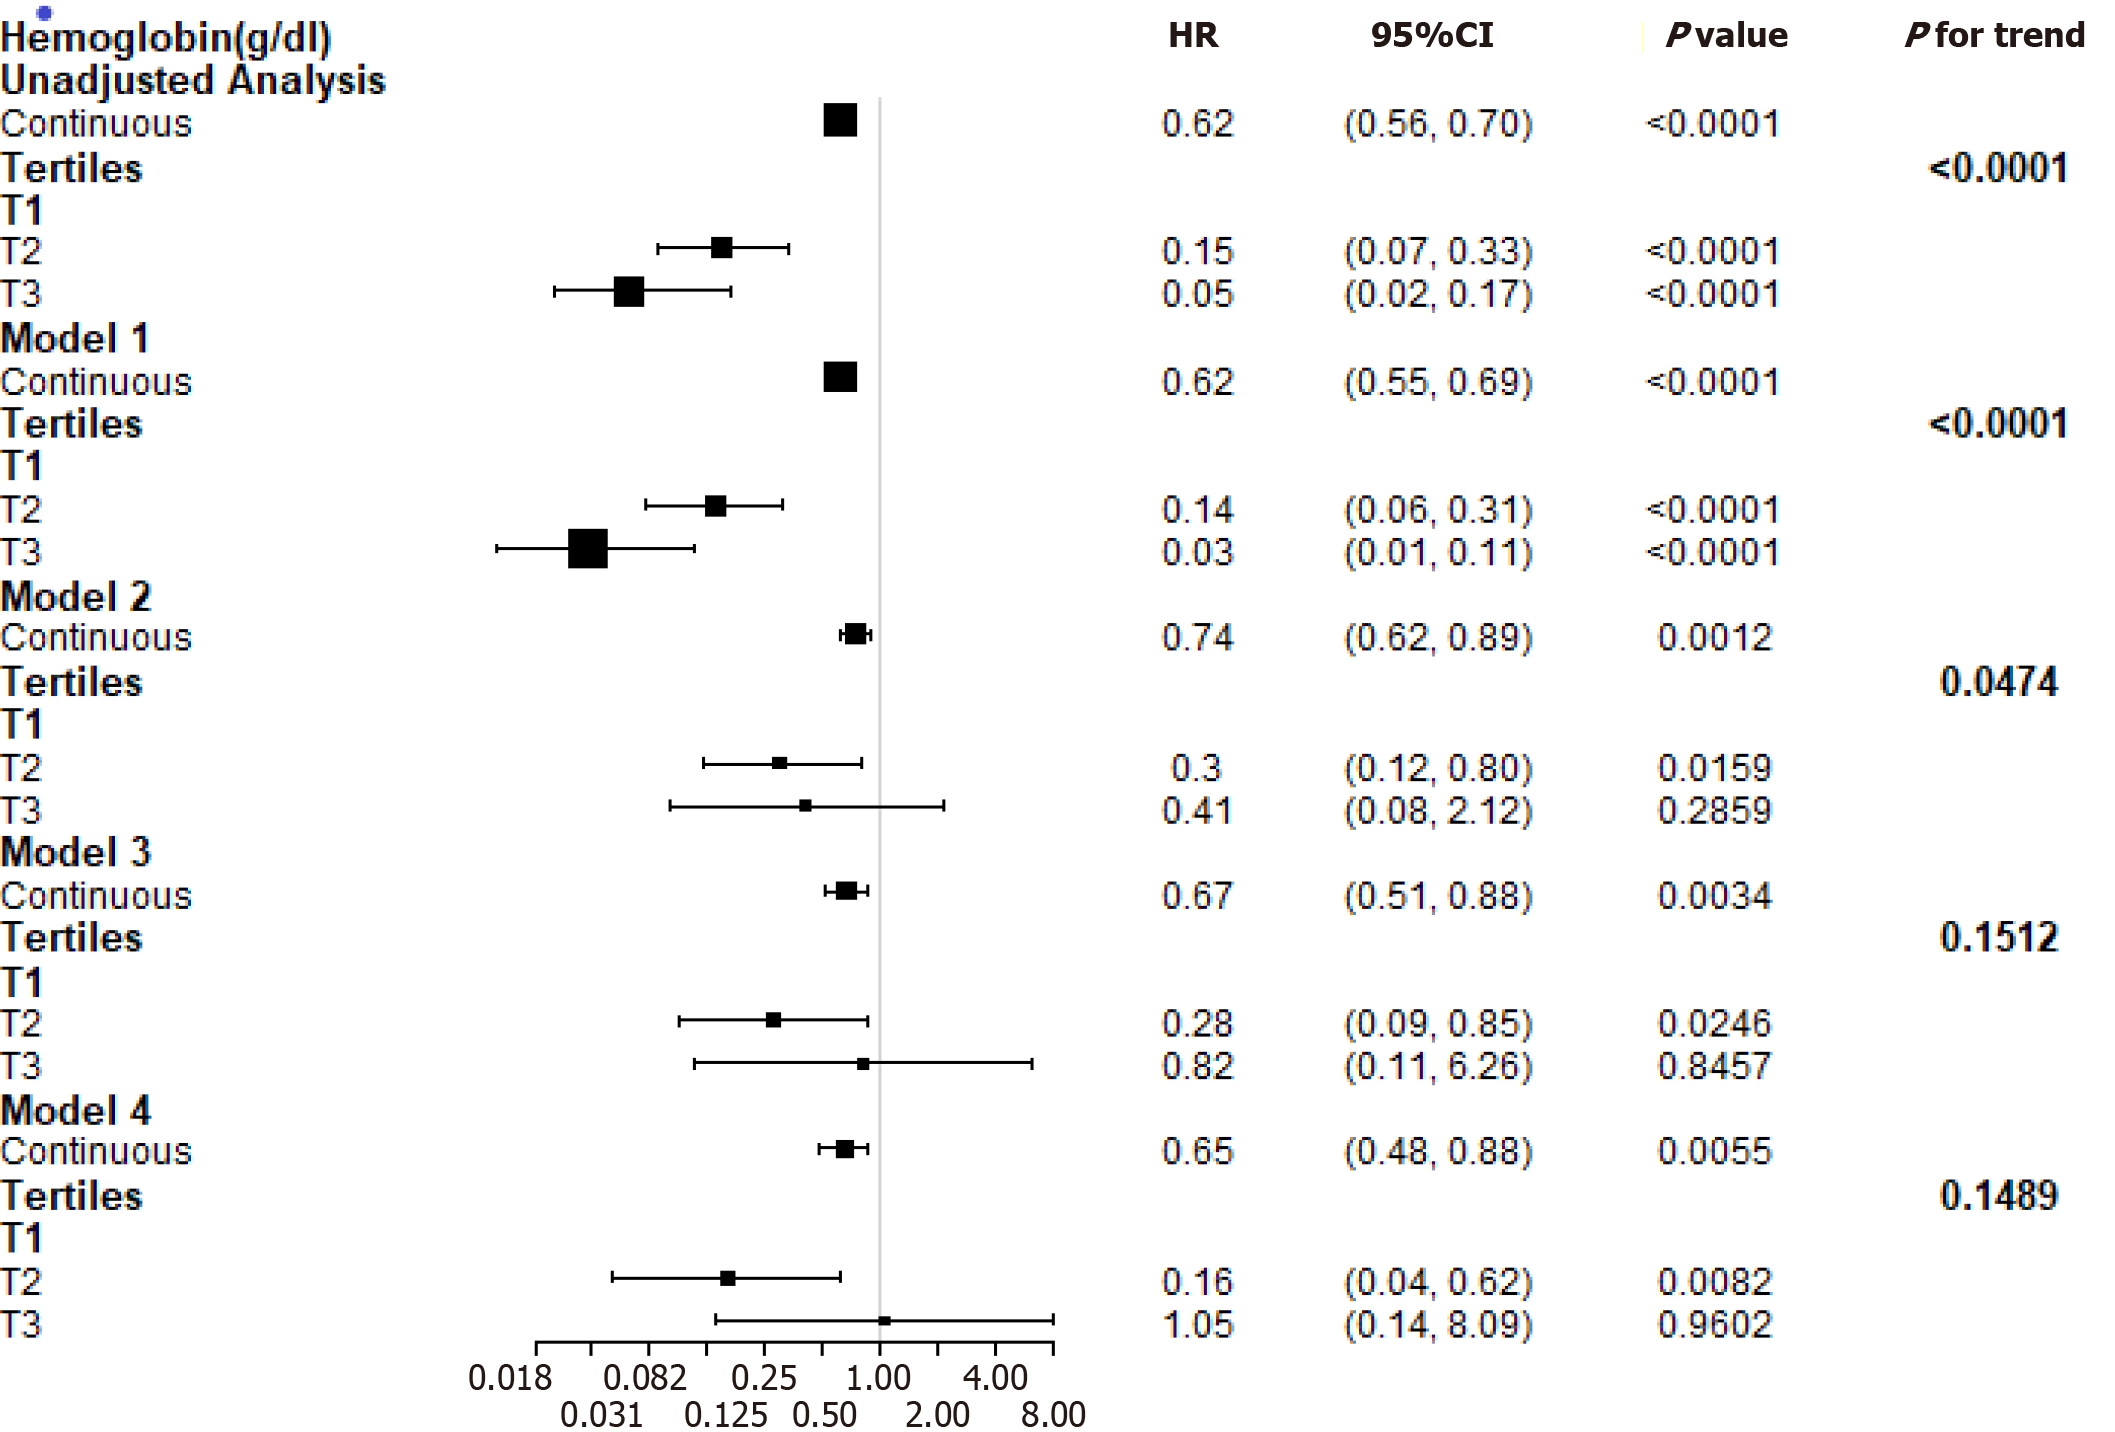
Figure 2 Estimated hazard ratio for the composite endpoint associated with hemoglobin in different models.
Model 1: Demographic factors (age, gender, and body mass index); model 2: Demographic factors and traditional renal function risk factors (baseline estimated glomerular filtration rate, history of hypertension, systolic blood pressure, diastolic blood pressure, 24-h urinary protein, angiotensin-converting enzyme inhibitors and/or angiotensin receptor blockers use, and albumin); model 3: Demographic factors, traditional risk factors, and lipids (total cholesterol and triglycerides); model 4: Demographic factors, traditional risk factors, lipids, and glycaemia control (duration of diabetes, fasting glycaemia, and glycosylated hemoglobin). HR: Hazard ratio; CI: Confidence interval.
- Citation: Song HY, Wei CM, Zhou WX, Hu HF, Wan QJ. Association between admission hemoglobin level and prognosis in patients with type 2 diabetes mellitus. World J Diabetes 2021; 12(11): 1917-1927
- URL: https://www.wjgnet.com/1948-9358/full/v12/i11/1917.htm
- DOI: https://dx.doi.org/10.4239/wjd.v12.i11.1917


