Copyright
©The Author(s) 2021.
World J Diabetes. Nov 15, 2021; 12(11): 1894-1907
Published online Nov 15, 2021. doi: 10.4239/wjd.v12.i11.1894
Published online Nov 15, 2021. doi: 10.4239/wjd.v12.i11.1894
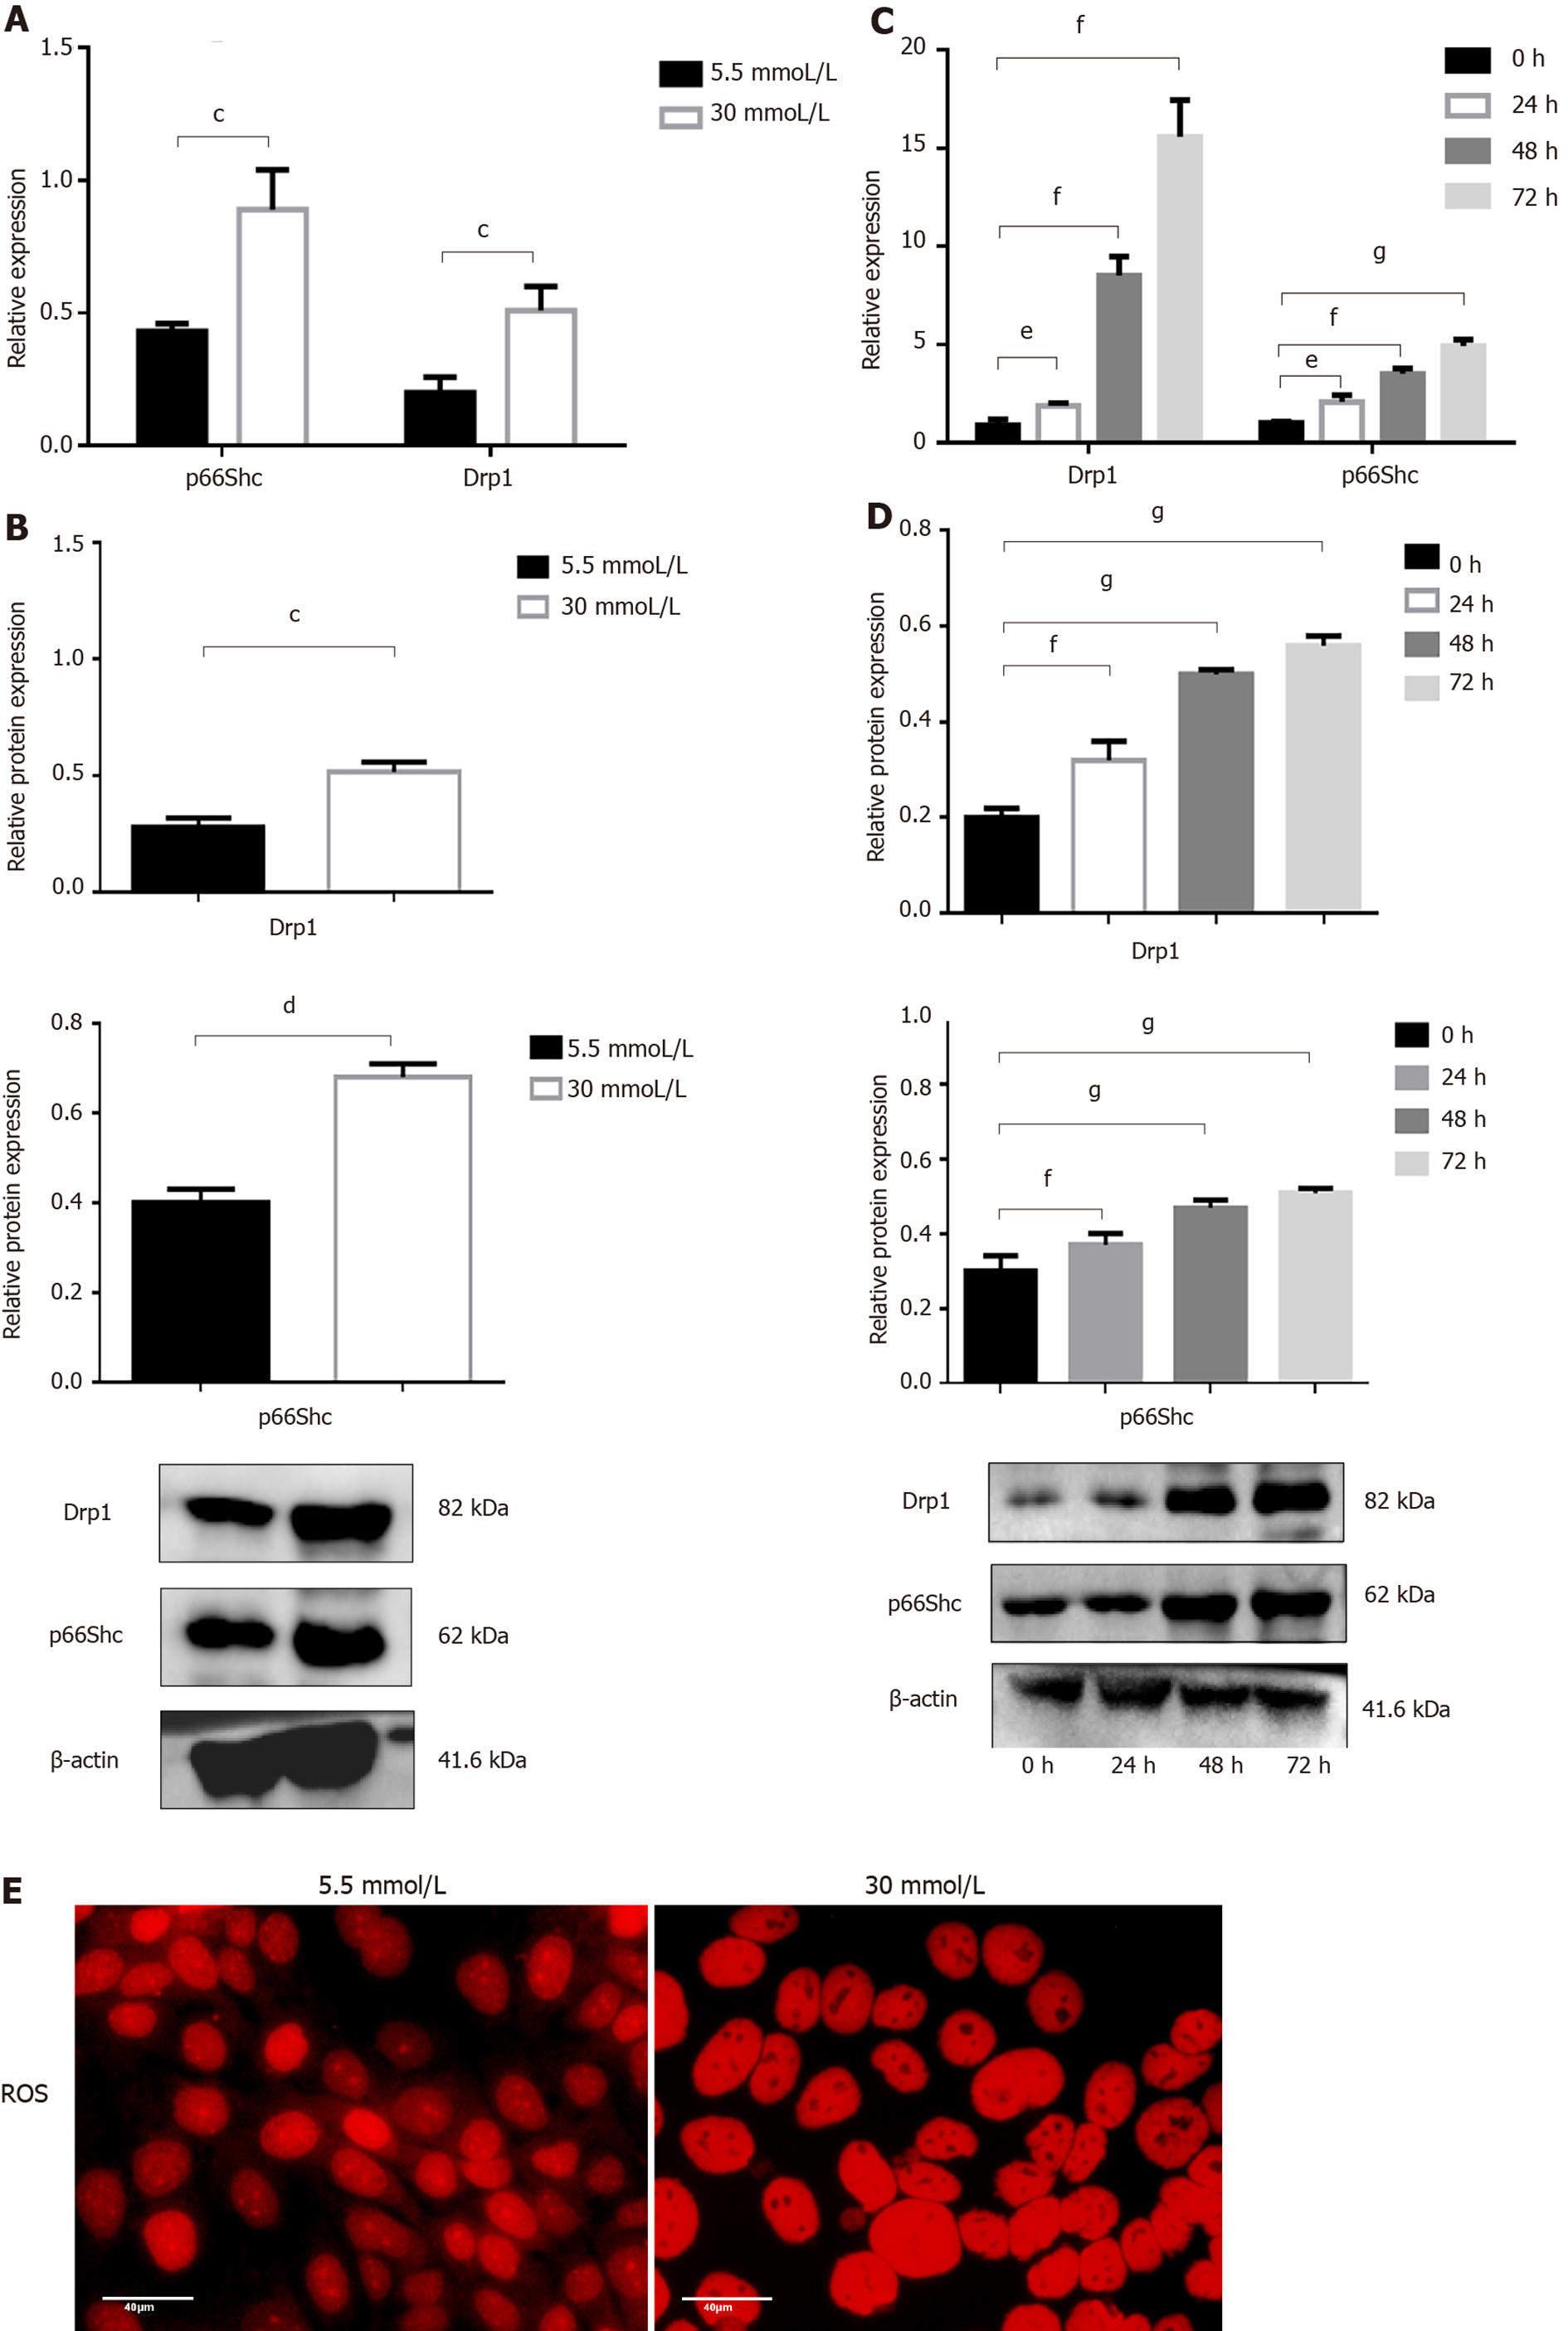
Figure 3 Expression of p66Shc and dynamin-related protein 1 in JEG3 cells treated with 5.
5 mmol/L or 30 mmol/L glucose. A: mRNA expression of dynamin-related protein 1 (Drp1) and p66Shc at 24 h were determined by quantitative real-time PCR); B: Protein expression of Drp1 and p66Shc at 24 h was determined by western blotting; C: Drp1 and p66Shc expression of at 0 h, 24 h, 48 h, and 72 h with 30 mmol/L was determined by quantitative real-time PCR; D: Expression of Drp1 and p66Shc at 0 h, 24 h, 48 h, and 72 h with 30 mmol/L were determined by western blotting; E: Reactive oxygen species at 24 h was determined by diluted dihydroethidium staining. cP < 0.05 vs 24 h in 5.5 mmol/L; dP < 0.01 vs 24 h in 5.5 mmol/L; eP < 0.05 vs 0 h in 30 mmol/L; fP < 0.01 vs 0 h in 30 mmol/L; gP < 0.001 vs 0 h in 30 mmol/L. Drp1: Dynamin-related protein 1; ROS: reactive oxygen species.
- Citation: Huang TT, Sun WJ, Liu HY, Ma HL, Cui BX. p66Shc-mediated oxidative stress is involved in gestational diabetes mellitus. World J Diabetes 2021; 12(11): 1894-1907
- URL: https://www.wjgnet.com/1948-9358/full/v12/i11/1894.htm
- DOI: https://dx.doi.org/10.4239/wjd.v12.i11.1894


