Copyright
©The Author(s) 2021.
World J Diabetes. Jan 15, 2021; 12(1): 19-46
Published online Jan 15, 2021. doi: 10.4239/wjd.v12.i1.19
Published online Jan 15, 2021. doi: 10.4239/wjd.v12.i1.19
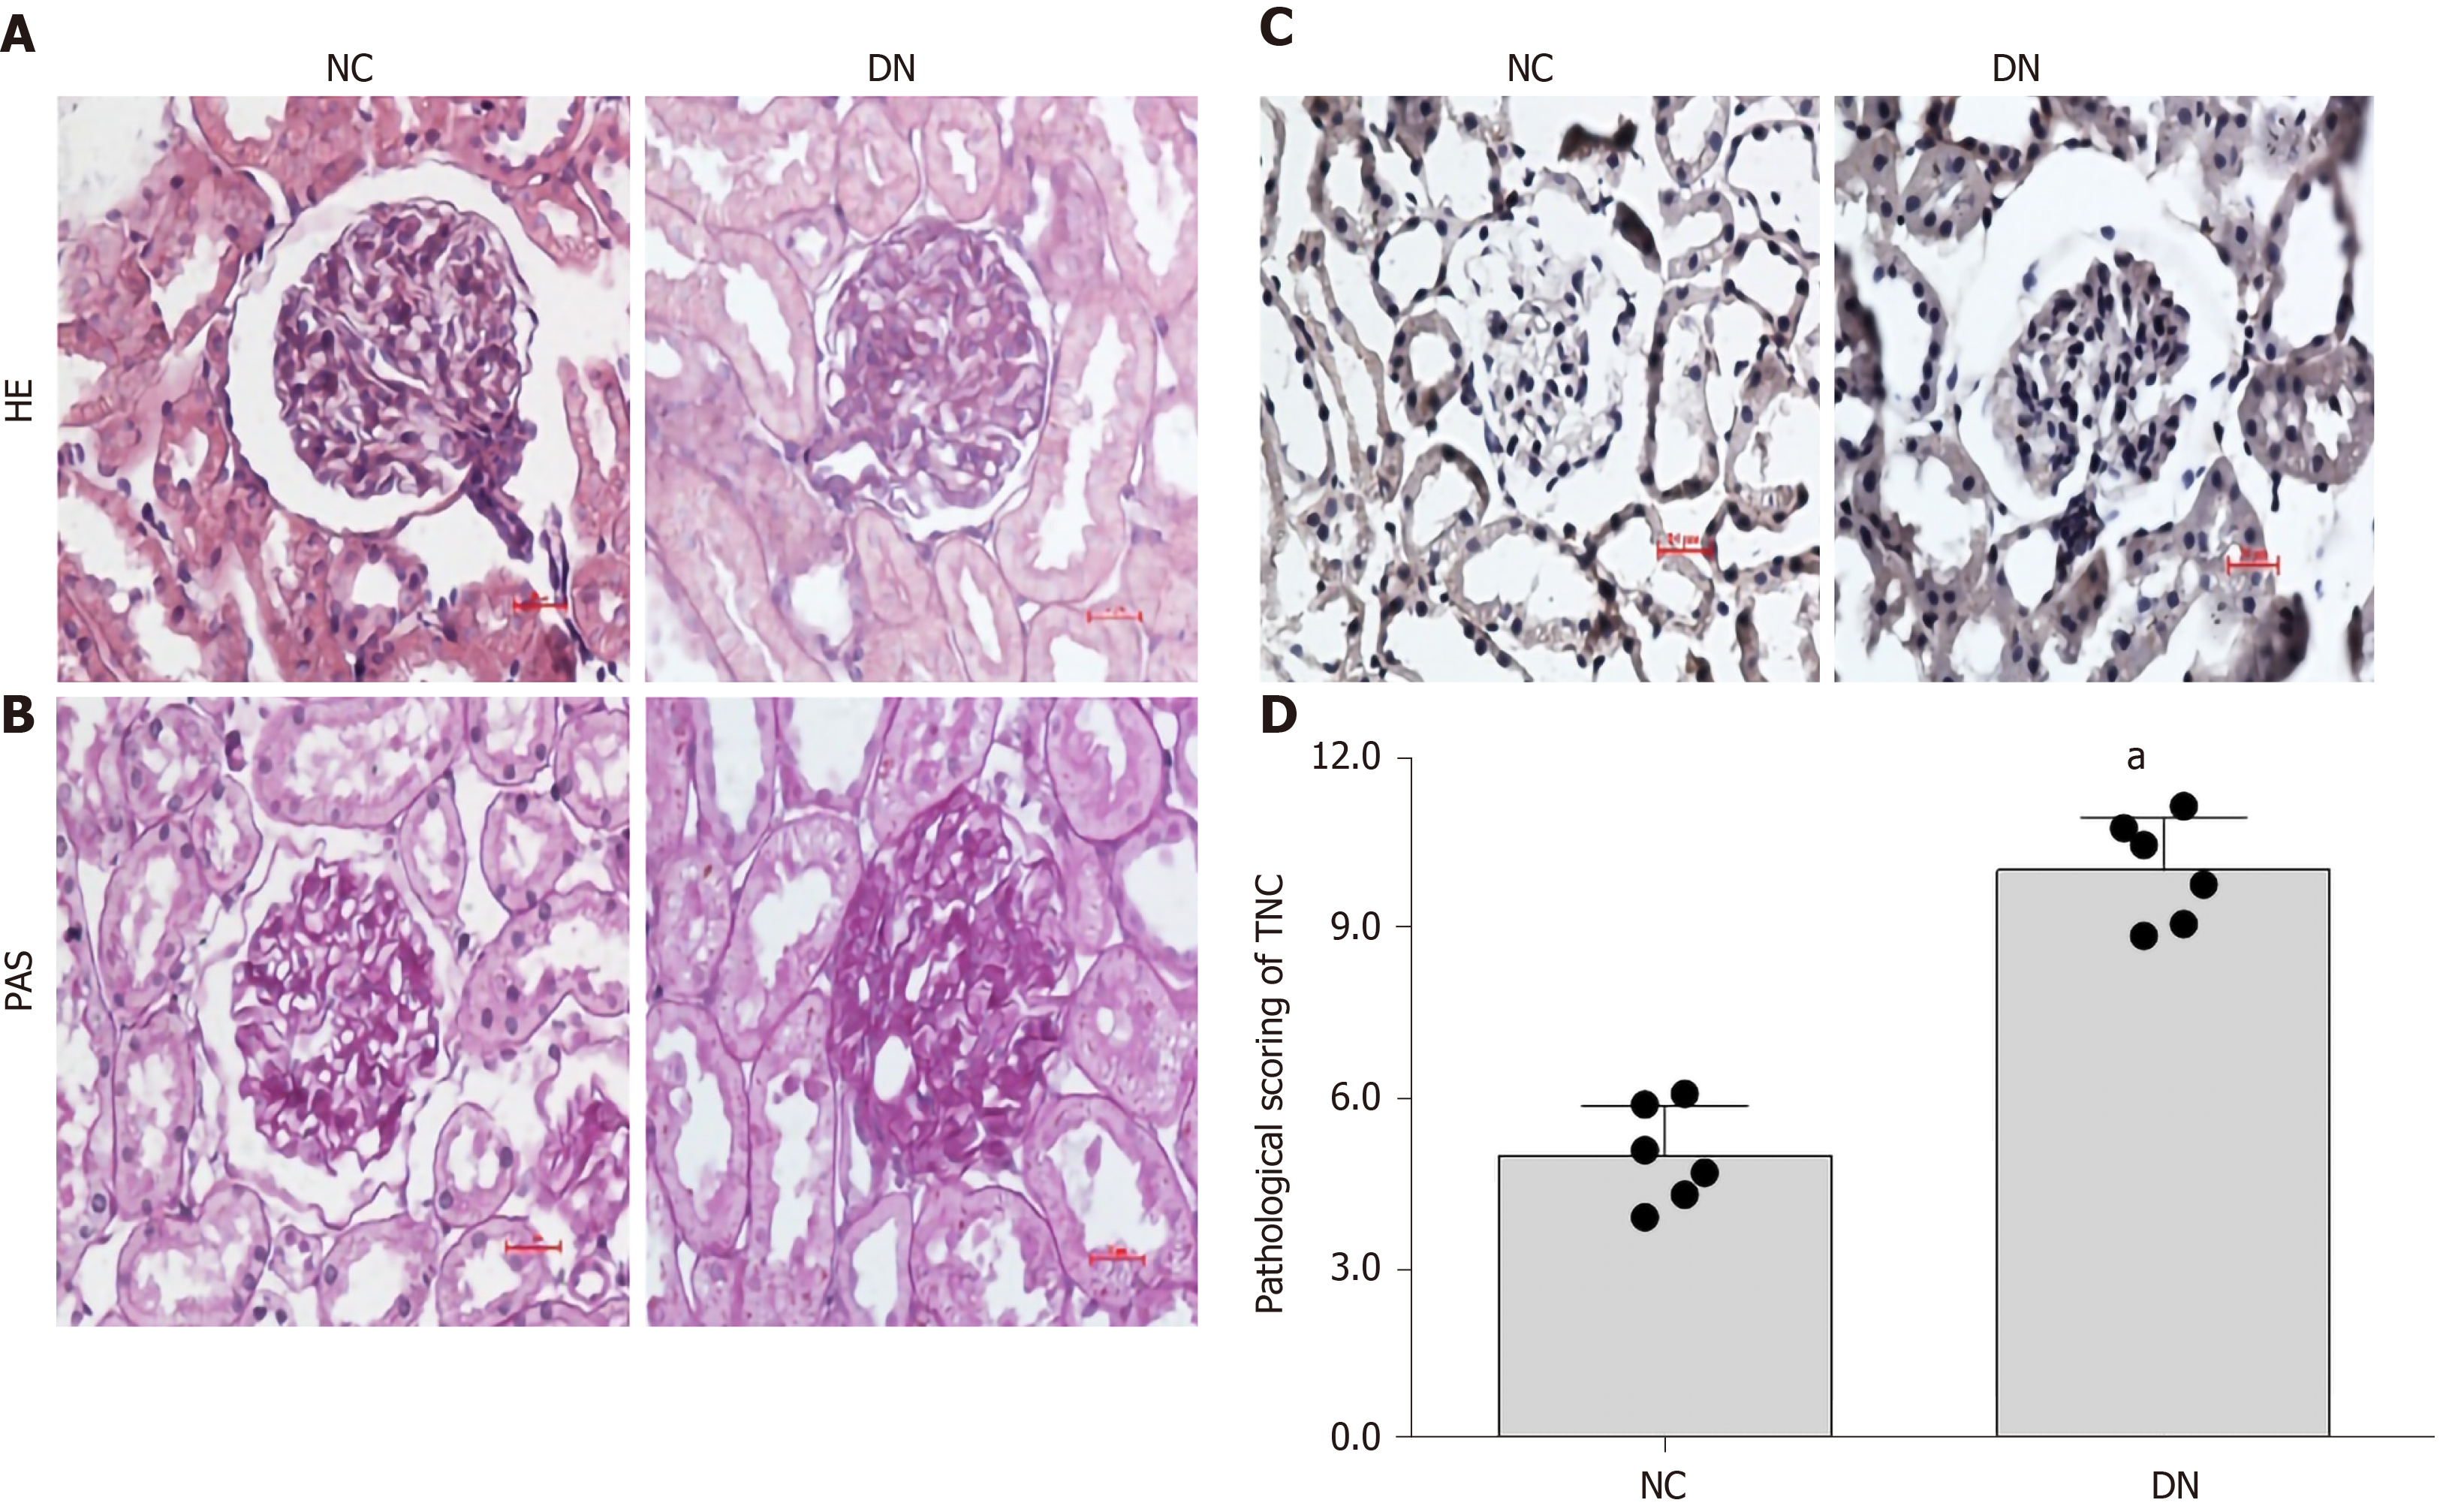
Figure 2 Histological changes and tenascin-C expression in the kidneys of diabetic rats.
A: Hematoxylin-eosin staining; B: Periodic acid-Schiff staining (400 ×); C: Immunohistochemical staining; D: Pathological scoring of tenascin-C (TNC). Scale bar: 20 μm. Representative immunohistochemical images and immunohistochemical scores for TNC in renal section are shown. aP < 0.05 compared with the NC control group. NC, n = 6, DN, n = 6. NC: Normal rat renal section; DN: Diabetic rat renal section; HE: Hematoxylin-eosin; PAS: Periodic acid-Schiff; TNC: Tenascin-C.
- Citation: Zhou Y, Ma XY, Han JY, Yang M, Lv C, Shao Y, Wang YL, Kang JY, Wang QY. Metformin regulates inflammation and fibrosis in diabetic kidney disease through TNC/TLR4/NF-κB/miR-155-5p inflammatory loop. World J Diabetes 2021; 12(1): 19-46
- URL: https://www.wjgnet.com/1948-9358/full/v12/i1/19.htm
- DOI: https://dx.doi.org/10.4239/wjd.v12.i1.19


