Copyright
©The Author(s) 2020.
World J Diabetes. Dec 15, 2020; 11(12): 611-621
Published online Dec 15, 2020. doi: 10.4239/wjd.v11.i12.611
Published online Dec 15, 2020. doi: 10.4239/wjd.v11.i12.611
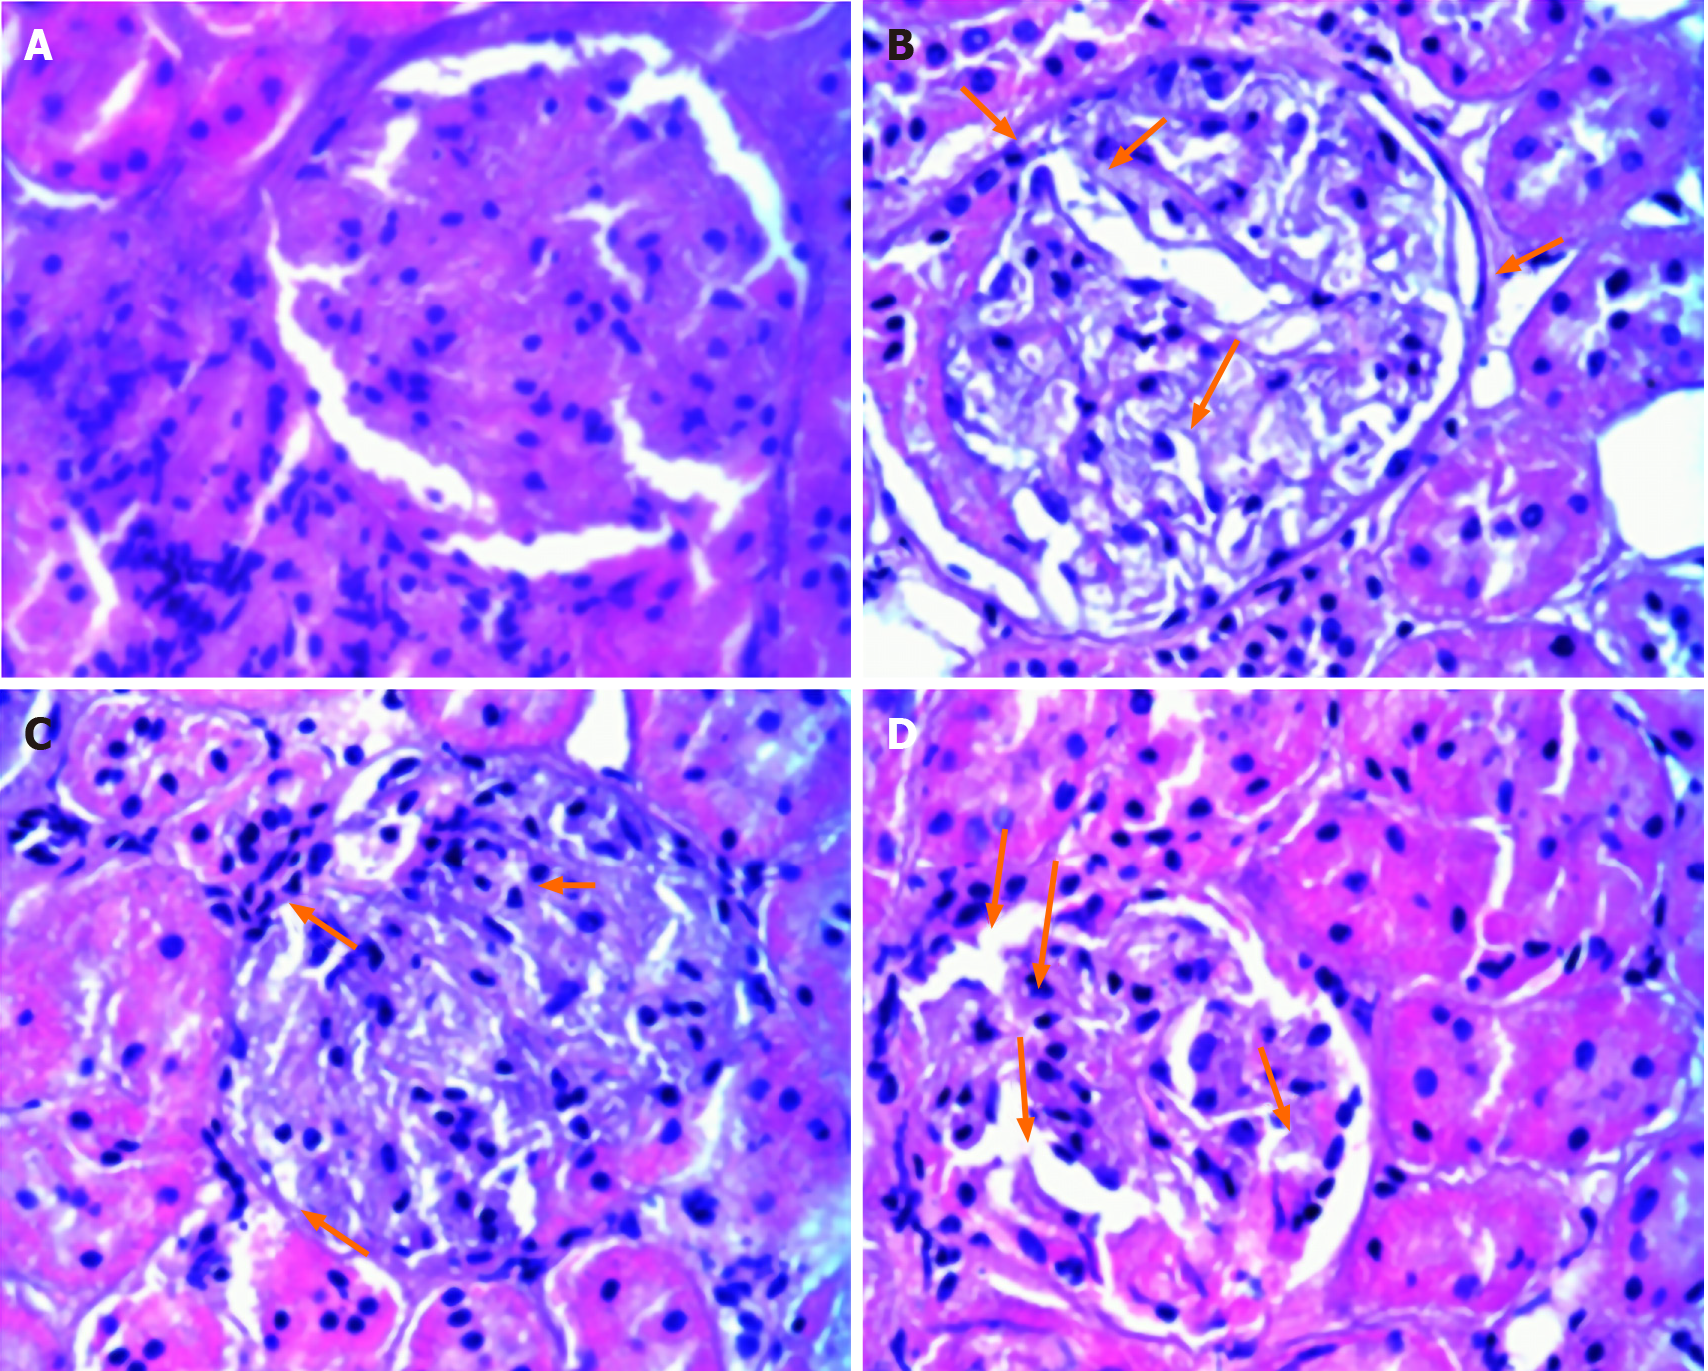
Figure 4 Periodic acid-Schiff staining images of the rat kidney tissue (40 ×).
A: Normal control group; B: Model group; C: Low-dose liraglutide group; D: High-dose liraglutide group. There were 24 rats in total, with 6 rats in each group. Yellow arrows indicate the degree of glomerular volume change, the number of inflammatory cells, and the state of glomerular basement membrane and mesangial proliferation.
- Citation: Zhao XY, Yu TT, Liu S, Liu YJ, Liu JJ, Qin J. Effect of liraglutide on endoplasmic reticulum stress in the renal tissue of type 2 diabetic rats. World J Diabetes 2020; 11(12): 611-621
- URL: https://www.wjgnet.com/1948-9358/full/v11/i12/611.htm
- DOI: https://dx.doi.org/10.4239/wjd.v11.i12.611


