Copyright
©The Author(s) 2020.
World J Diabetes. Nov 15, 2020; 11(11): 501-513
Published online Nov 15, 2020. doi: 10.4239/wjd.v11.i11.501
Published online Nov 15, 2020. doi: 10.4239/wjd.v11.i11.501
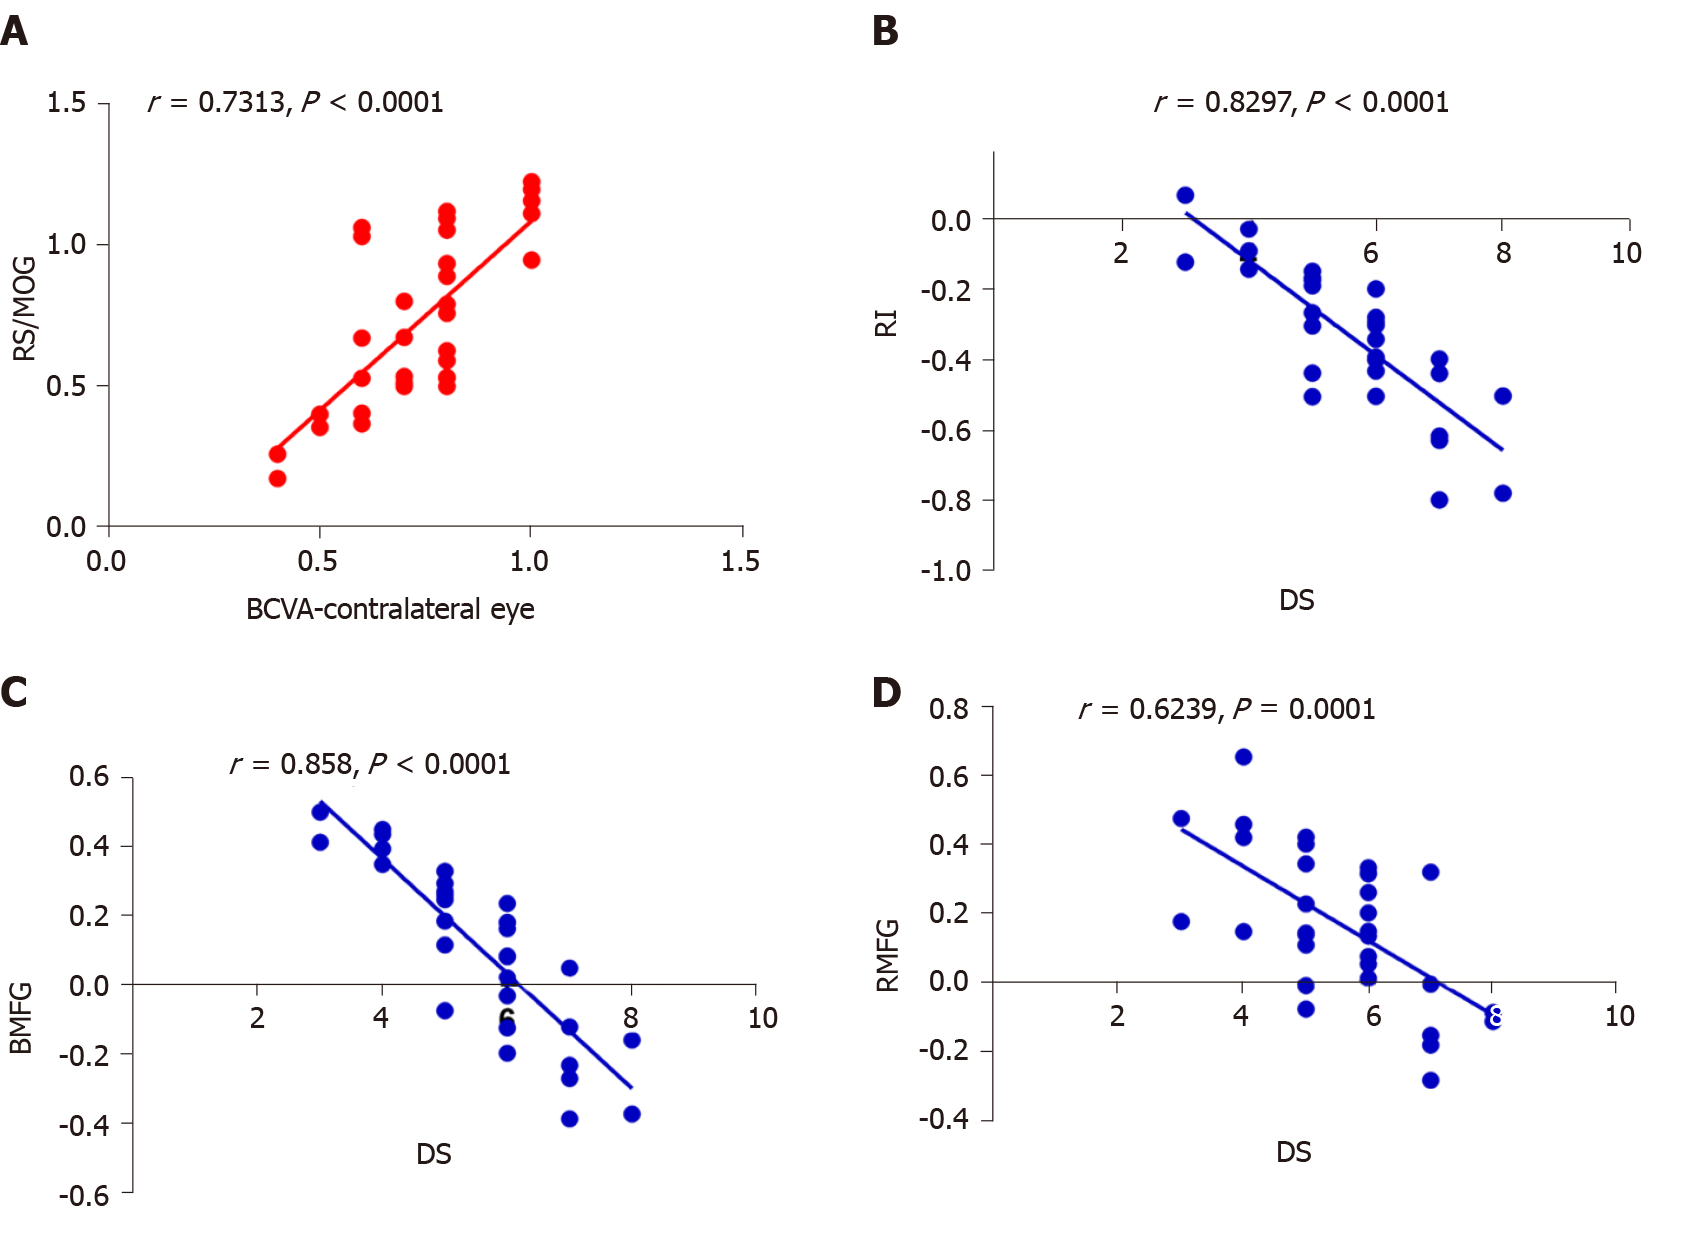
Figure 4 Correlations between mean regional homogeneity signal values of different areas and behavior performances.
A: In diabetic vitreous hemorrhage (DVH) group, best-corrected visual acuity of the contralateral eye showed a positive correlation with the mean regional homogeneity (ReHo) signal value of the right superior/middle occipital gyrus (r = 0.7313, P < 0.0001); B: Depression score in DVH group showed a negative correlation with the mean ReHo signal value of the right insula (r = -0.8297, P < 0.0001); C: Bilateral medial frontal gyrus (r = -0.858, P < 0.0001); D: Right middle frontal gyrus (r = -0.6239, P = 0.0001). RS: Right superior; MOG: Middle occipital gyrus; BCVA: Best-corrected visual acuity; RI: Right insula; DS: Depression score; BMFG: Bilateral medial frontal gyrus; RMFG: Right middle frontal gyrus.
- Citation: Zhang YQ, Zhu FY, Tang LY, Li B, Zhu PW, Shi WQ, Lin Q, Min YL, Shao Y, Zhou Q. Altered regional homogeneity in patients with diabetic vitreous hemorrhage. World J Diabetes 2020; 11(11): 501-513
- URL: https://www.wjgnet.com/1948-9358/full/v11/i11/501.htm
- DOI: https://dx.doi.org/10.4239/wjd.v11.i11.501


