Copyright
©The Author(s) 2020.
World J Diabetes. Nov 15, 2020; 11(11): 501-513
Published online Nov 15, 2020. doi: 10.4239/wjd.v11.i11.501
Published online Nov 15, 2020. doi: 10.4239/wjd.v11.i11.501
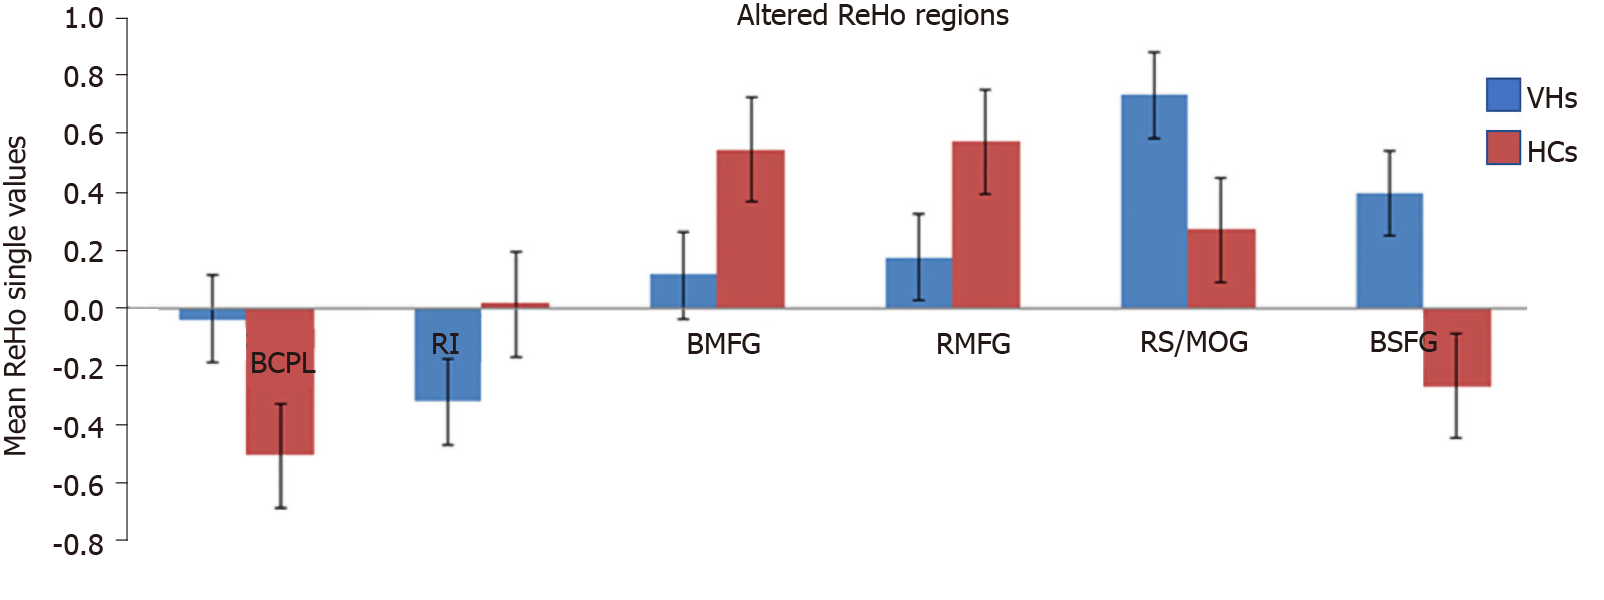
Figure 3 Mean regional homogeneity values between the diabetic vitreous hemorrhage and healthy control groups.
ReHo: Regional homogeneity; VH: Vitreous hemorrhage; HC: Healthy control; BCPL: Bilateral cerebellum posterior lobe; RI: Right insula; BMFG: Bilateral medial frontal gyrus; RMFG: Right middle frontal gyrus; RS: Right superior; MOG: Middle occipital gyrus; BSFG: Bilateral superior frontal gyrus.
- Citation: Zhang YQ, Zhu FY, Tang LY, Li B, Zhu PW, Shi WQ, Lin Q, Min YL, Shao Y, Zhou Q. Altered regional homogeneity in patients with diabetic vitreous hemorrhage. World J Diabetes 2020; 11(11): 501-513
- URL: https://www.wjgnet.com/1948-9358/full/v11/i11/501.htm
- DOI: https://dx.doi.org/10.4239/wjd.v11.i11.501


