Copyright
©The Author(s) 2020.
World J Diabetes. Nov 15, 2020; 11(11): 501-513
Published online Nov 15, 2020. doi: 10.4239/wjd.v11.i11.501
Published online Nov 15, 2020. doi: 10.4239/wjd.v11.i11.501
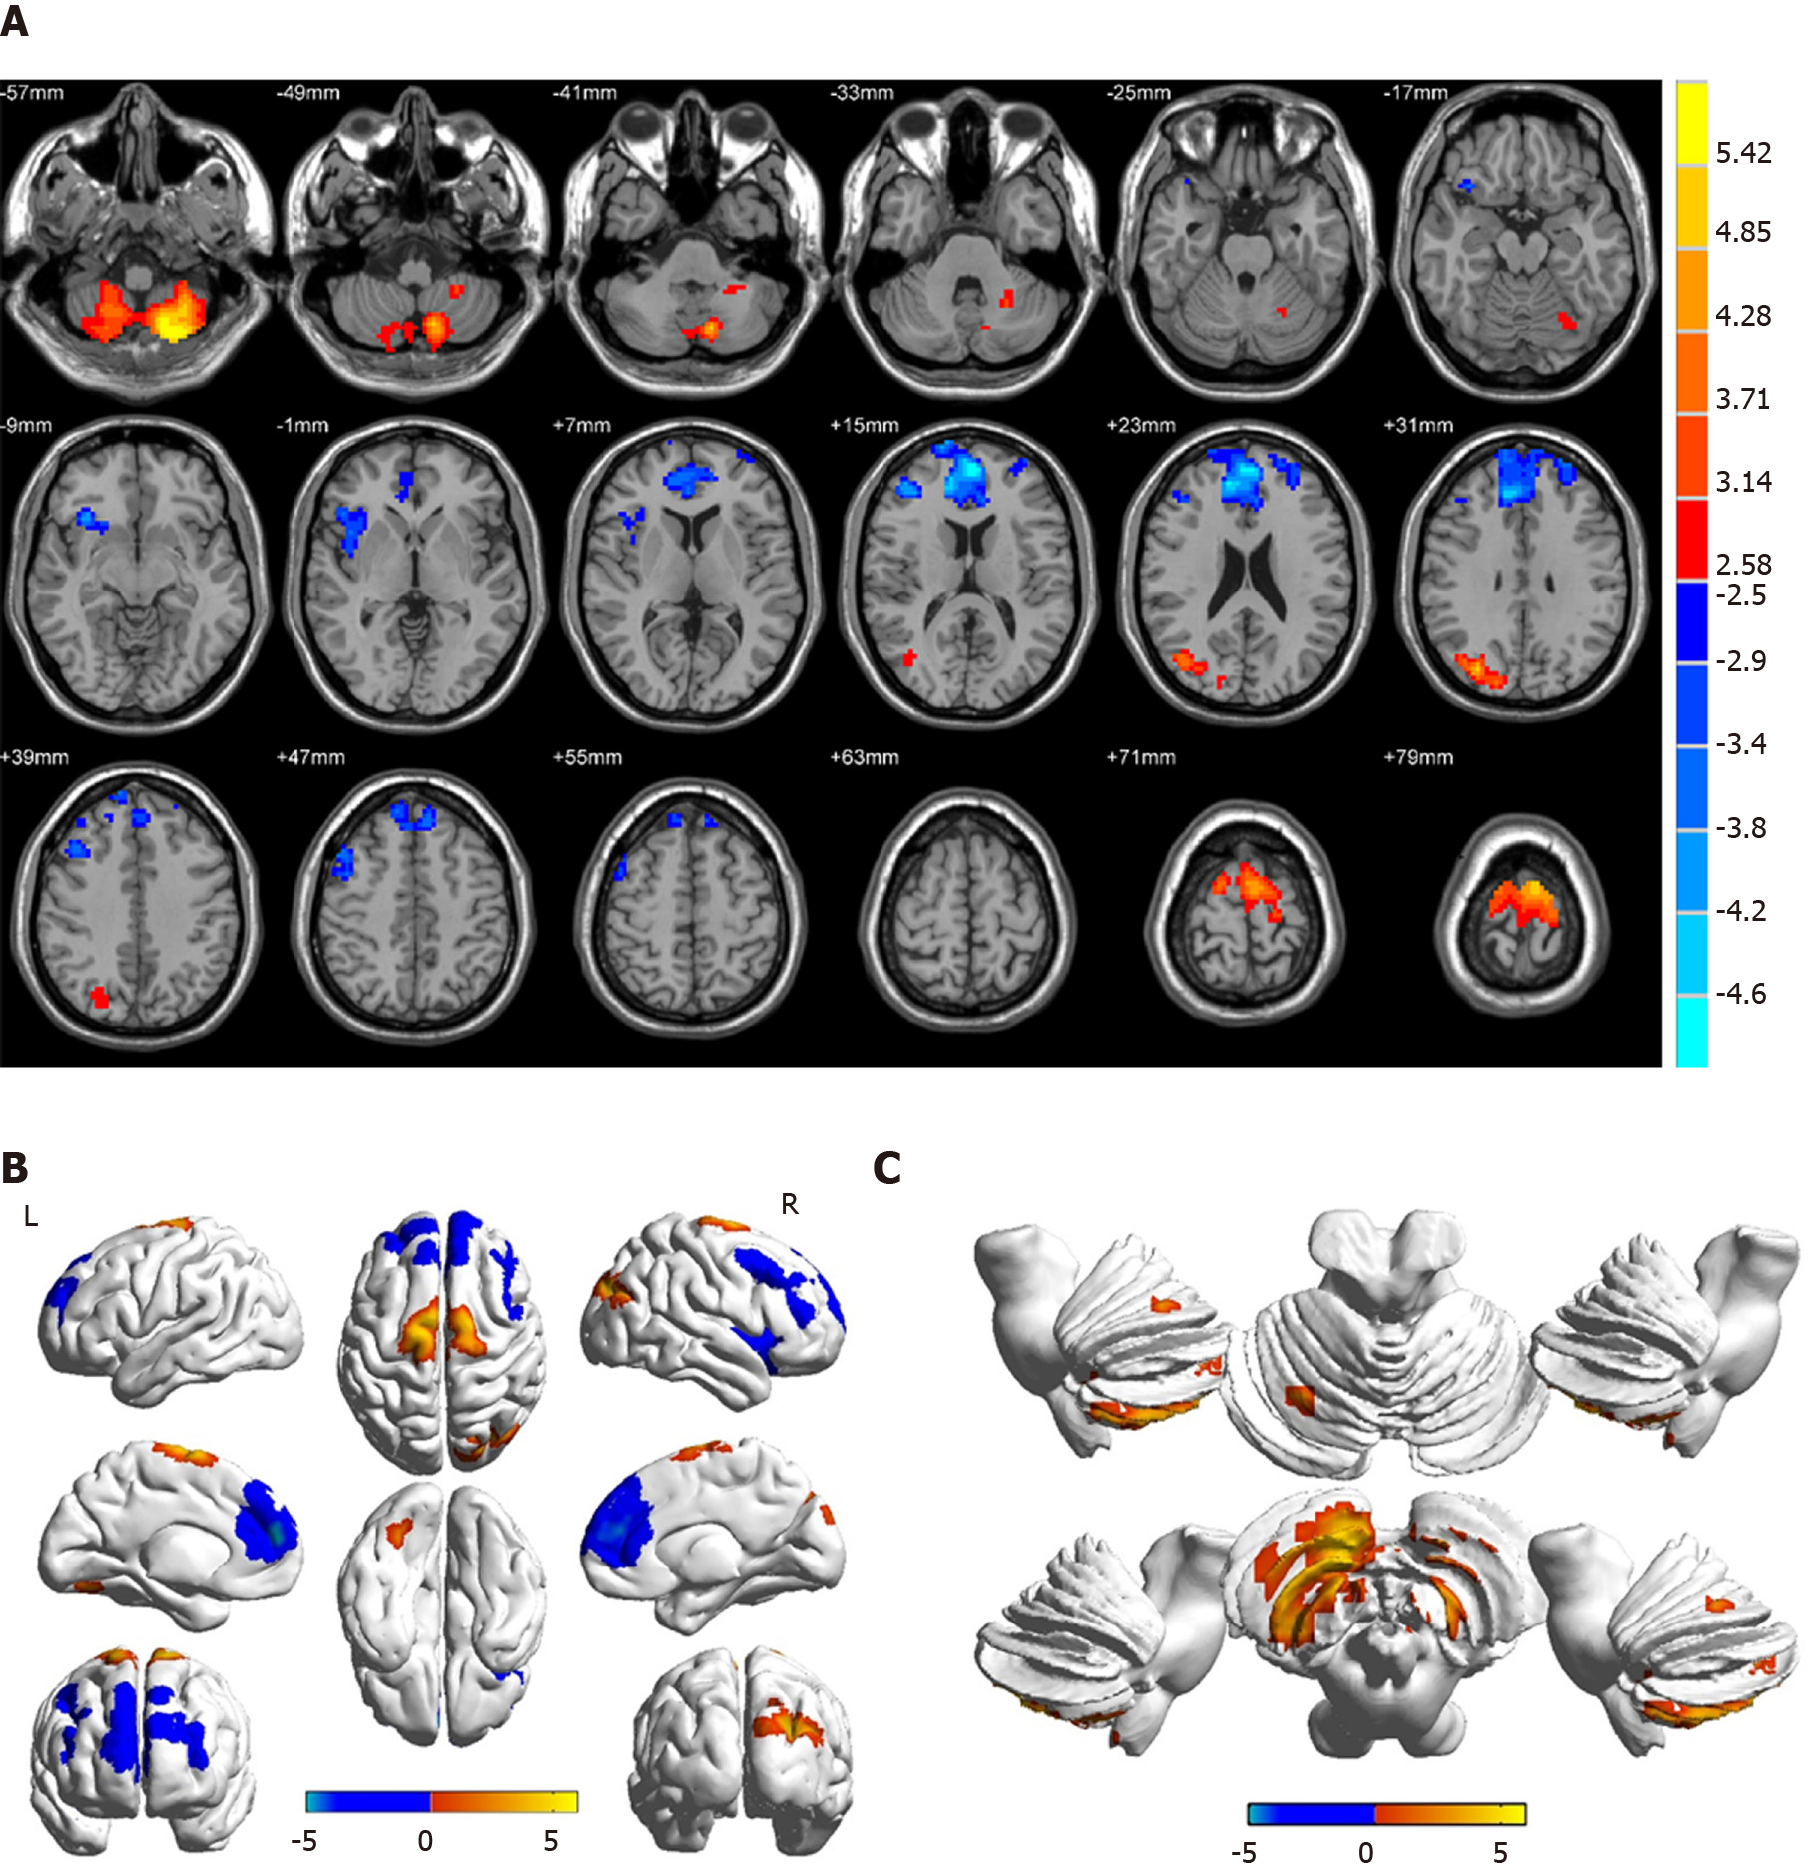
Figure 2 Spontaneous brain activity in patients with diabetic vitreous hemorrhage vs healthy controls.
Significant activity differences were observed in the bilateral cerebellum posterior lobe, right superior/middle occipital gyrus, bilateral superior frontal gyrus, right insula, bilateral medial frontal gyrus, and right middle frontal gyrus. Red denotes higher regional homogeneity values and blue denotes lower regional homogeneity values. P < 0.001 for multiple comparisons using Gaussian random field theory (z > 2.3, P < 0.001, cluster > 40 voxels, AlphaSim corrected). R: Right; L: Left.
- Citation: Zhang YQ, Zhu FY, Tang LY, Li B, Zhu PW, Shi WQ, Lin Q, Min YL, Shao Y, Zhou Q. Altered regional homogeneity in patients with diabetic vitreous hemorrhage. World J Diabetes 2020; 11(11): 501-513
- URL: https://www.wjgnet.com/1948-9358/full/v11/i11/501.htm
- DOI: https://dx.doi.org/10.4239/wjd.v11.i11.501


