Copyright
©The Author(s) 2015.
World J Diabetes. Mar 15, 2015; 6(2): 304-311
Published online Mar 15, 2015. doi: 10.4239/wjd.v6.i2.304
Published online Mar 15, 2015. doi: 10.4239/wjd.v6.i2.304
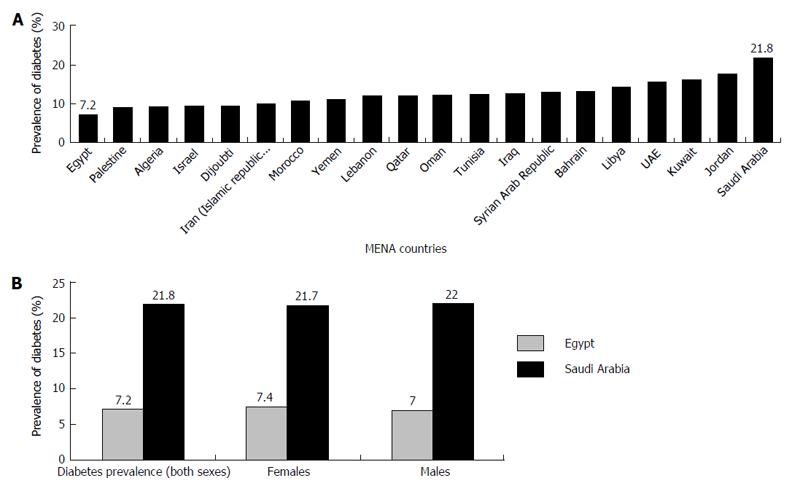
Figure 1 Prevalence of diabetes in Middle East and North Africa region.
A: Middle East and North Africa (MENA) countries as defined by the World Bank arranged in increasing prevalence of diabetes; B: Prevalence of diabetes in both genders of Egyptian and Saudi Arabia population. From World Health Organization, 2008. UAE: United Arab Emirates.
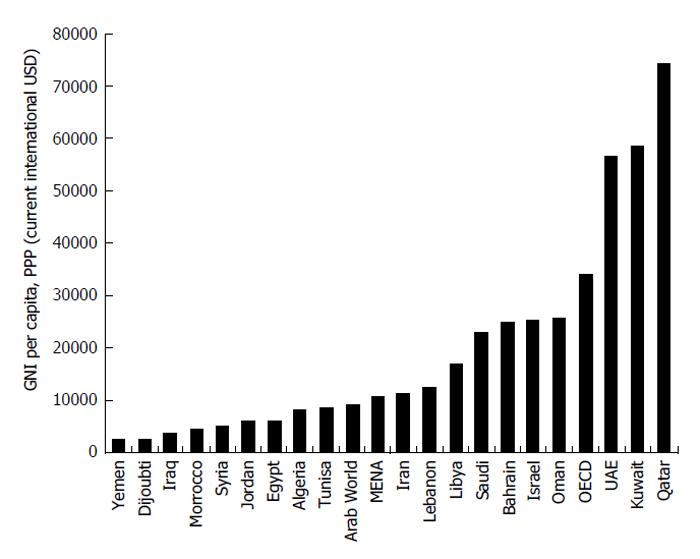
Figure 2 Gross national income per capita based on purchasing power parity of Middle East and North Africa countries.
Egypt falls bellows Arab world average ($5710 vs $8882) where Saudi Arabia is well above average ($22760). OECD: Organization for Economic Co-operation and Development. From World Bank, 2008. UAE: United Arab Emirates; PPP: Purchasing power parity; GNI: Gross national income.
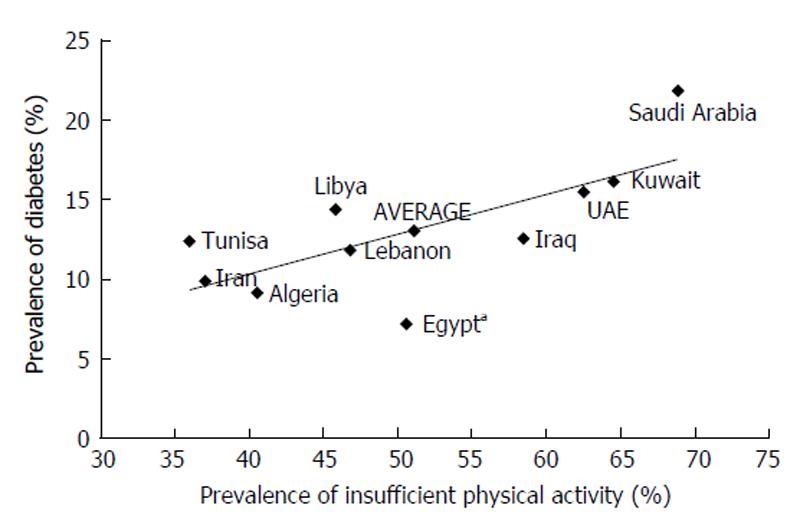
Figure 3 Prevalence of insufficient physical activity in Middle East and North Africa countries compared to prevalence of diabetes.
The region’s average of prevalence of insufficient physical activity is estimated to be 51.1%. Tunisia and Saudi Arabia are on the two ends of prevalence of physical inactivity in the region (35.9% vs 68.8%). Egypt’s prevalence of insufficient physical activity is approximately at the region’s average (50.6%). The correlation coefficient of the relationship between prevalence of insufficient physical activity and prevalence of diabetes indicate a moderate positive linear relationship (R2 = 0.51). Regression Analysis of prevalence of Insufficient physical activity vs prevalence of diabetes showed statistical significance (P = 0.01). From World Health Organization, 2008. aMinistry of Health and population, Egypt Preventive Sector Central Epidemiology and Disease Surveillance (ESU). Non-Communicable Disease Surveillance Unit Community based survey study on non-communicable diseases and their risk factors, Egypt, 2005-2006. UAE: United Arab Emirates.
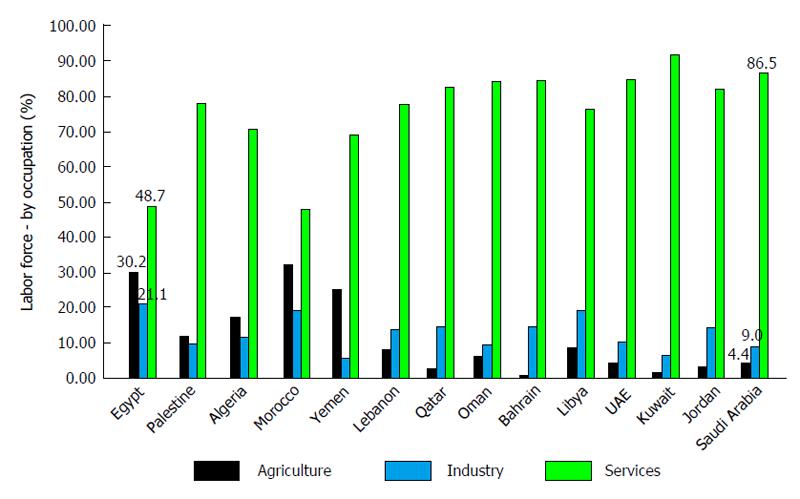
Figure 4 Middle East and North Africa countries labor force by occupation.
Diversity of the workforce of Middle East and North Africa countries arranged horizontally from lowest diabetes prevalence (left) to highest diabetes prevalence (right). Data from Arab Labor Organization, but data collected from each country varies from 2006 -2008 (Egypt, 2008; Saudi Arabia, 2007). UAE: United Arab Emirates.
- Citation: Sherif S, Sumpio BE. Economic development and diabetes prevalence in MENA countries: Egypt and Saudi Arabia comparison. World J Diabetes 2015; 6(2): 304-311
- URL: https://www.wjgnet.com/1948-9358/full/v6/i2/304.htm
- DOI: https://dx.doi.org/10.4239/wjd.v6.i2.304


