Copyright
©2013 Baishideng Publishing Group Co.
World J Diabetes. Apr 15, 2013; 4(2): 31-39
Published online Apr 15, 2013. doi: 10.4239/wjd.v4.i2.31
Published online Apr 15, 2013. doi: 10.4239/wjd.v4.i2.31
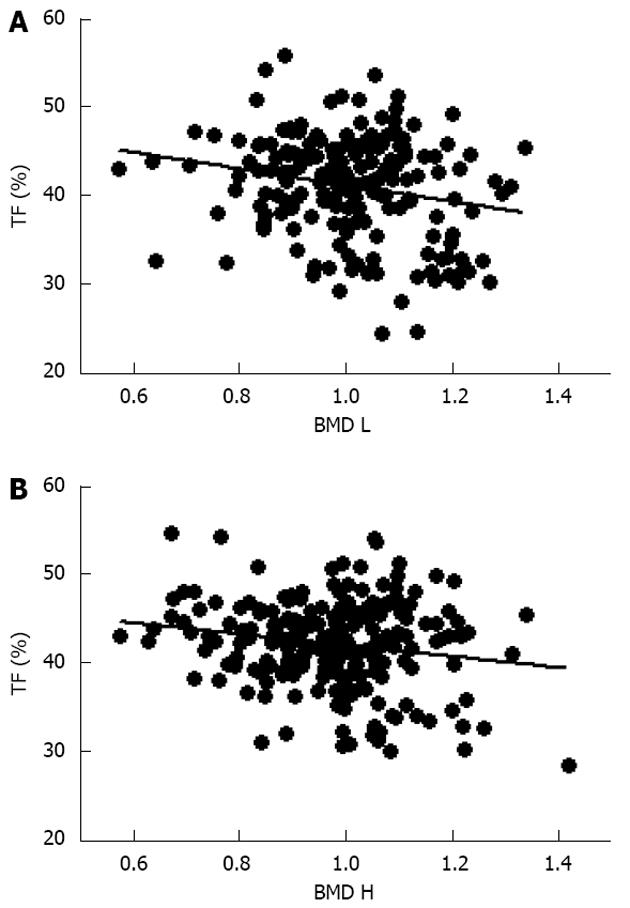
Figure 1 Correlation between trunk fat and bone mineral density at both lumbar and femoral sites.
A: Trunk fat (TF) percentage and bone mineral density at the lumbar (BMD L; r = -0.22, P < 0.001); B: Bone mineral density at the hip (BMD H, r = -0.22, P < 0.01).
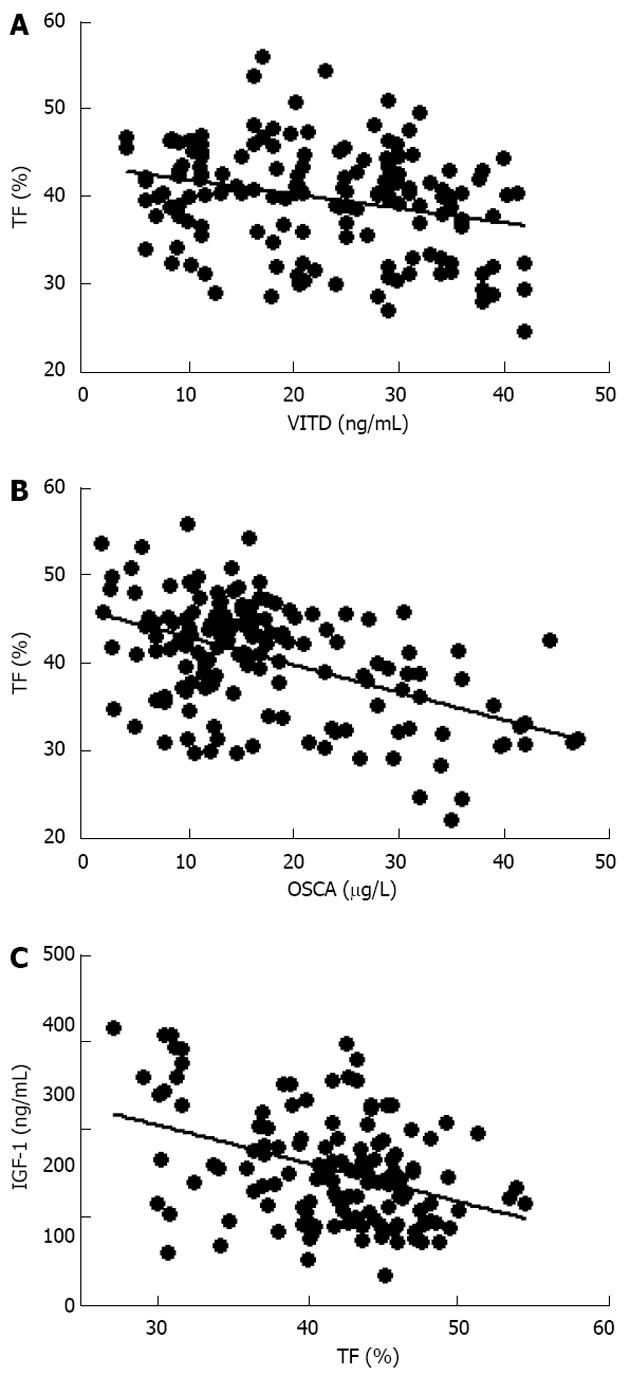
Figure 2 Inverse relationship between trunk fat percentage and vitamin D (A; r = -0.
27, P < 0.0005), osteocalcin (B; r = -0.49, P < 0.0001) and insulin-like growth factor-1 (C; r = -0.31, P < 0.0001) plasma levels in obese women. VITD: Vitamin D; OSCA: Osteocalcin; IGF-1: Insulin-like growth factor-1; TF: Trunk fat.
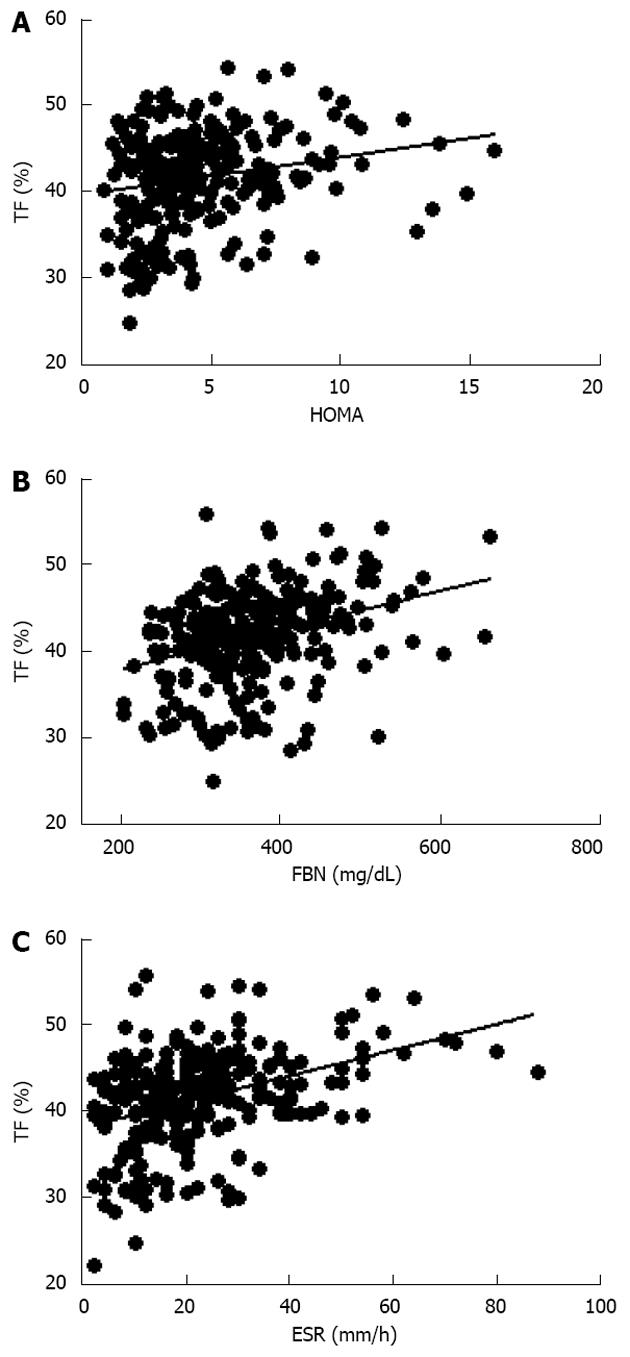
Figure 3 Direct relationship between trunk fat percentage, homeostasis model assessment index (A; r = 0.
18, P < 0.01), fibrinogen (B; r = 0.44, P < 0.0001) and erythrocyte sedimentation rate (C; r = 0.29, P < 0.0001) in obese women. HOMA: Homeostasis model assessment; FBN: Fibrinogen; ESR: Erythrocyte sedimentation rate; TF: Trunk fat.
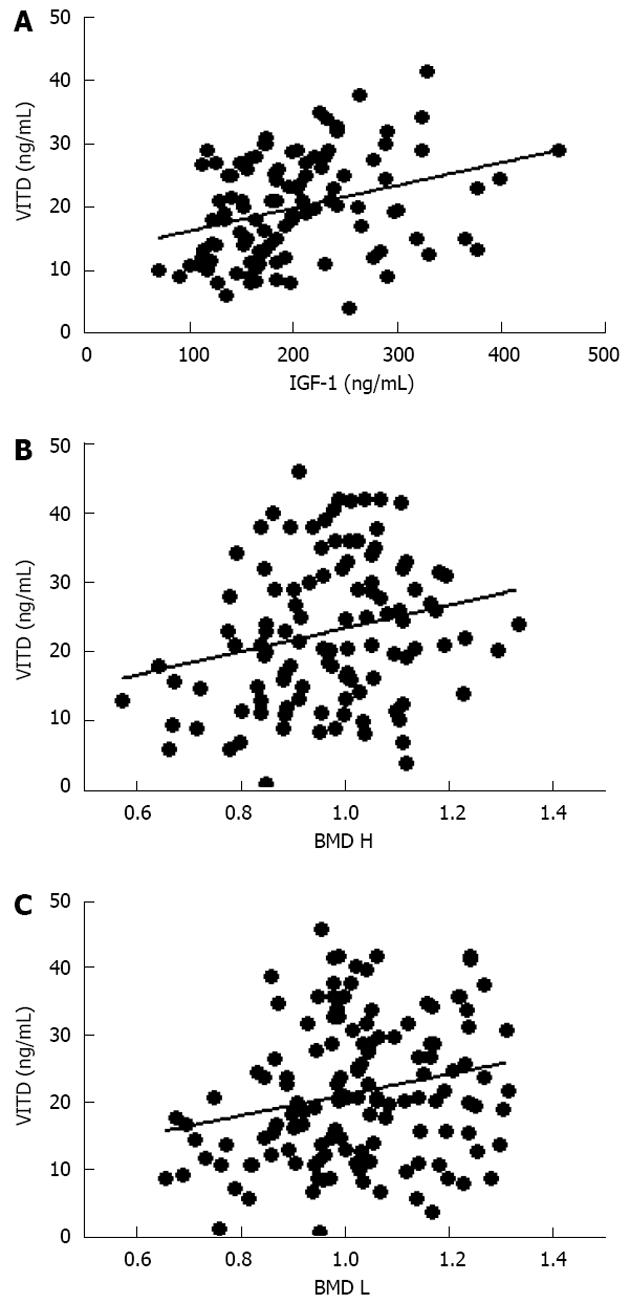
Figure 4 Direct relationship between vitamin D, insulin-like growth factor-1 (A; r = 0.
32, P < 0.0005), hip (B; r = 0.23, P < 0.01) and lumbar bone mineral density (C; r = 0.19, P < 0.005) in obese women. VITD: Vitamin D; IGF-1: Insulin-like growth factor-1; BMD H: Bone mineral density at the hip; BMD L: Bone mineral density at the lumbar; TF: Trunk fat.
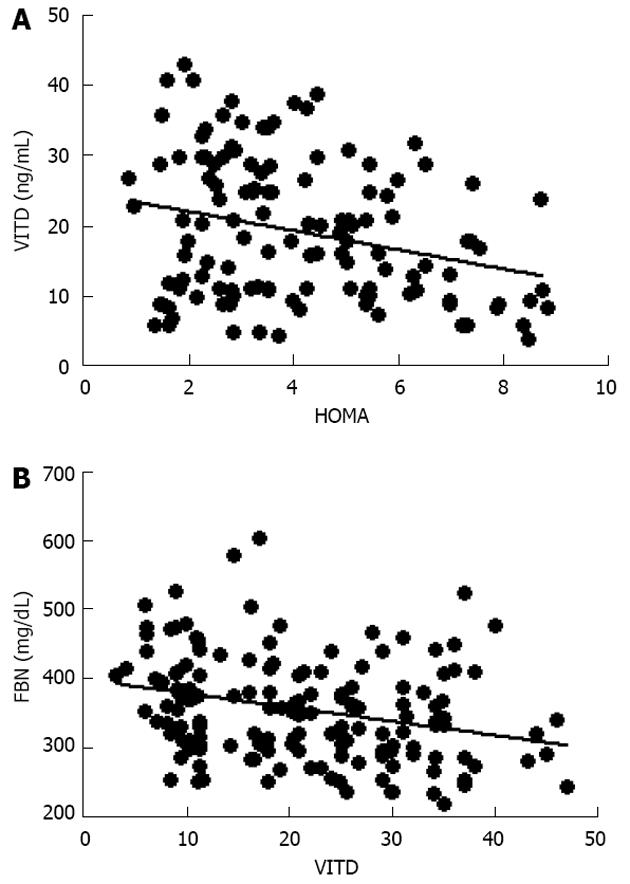
Figure 5 Inverse relationship between vitamin D levels with homeostasis model assessment (A; r = -0.
27, P < 0.001) and with fibrinogen (B; r = -0.28, P < 0.0005). VITD: Vitamin D; HOMA: Homeostasis model assessment; FBN: Fibrinogen.
- Citation: Greco EA, Francomano D, Fornari R, Marocco C, Lubrano C, Papa V, Wannenes F, Di Luigi L, Donini LM, Lenzi A, Aversa A, Migliaccio S. Negative association between trunk fat, insulin resistance and skeleton in obese women. World J Diabetes 2013; 4(2): 31-39
- URL: https://www.wjgnet.com/1948-9358/full/v4/i2/31.htm
- DOI: https://dx.doi.org/10.4239/wjd.v4.i2.31


