Copyright
©The Author(s) 2023.
World J Diabetes. Dec 15, 2023; 14(12): 1754-1765
Published online Dec 15, 2023. doi: 10.4239/wjd.v14.i12.1754
Published online Dec 15, 2023. doi: 10.4239/wjd.v14.i12.1754
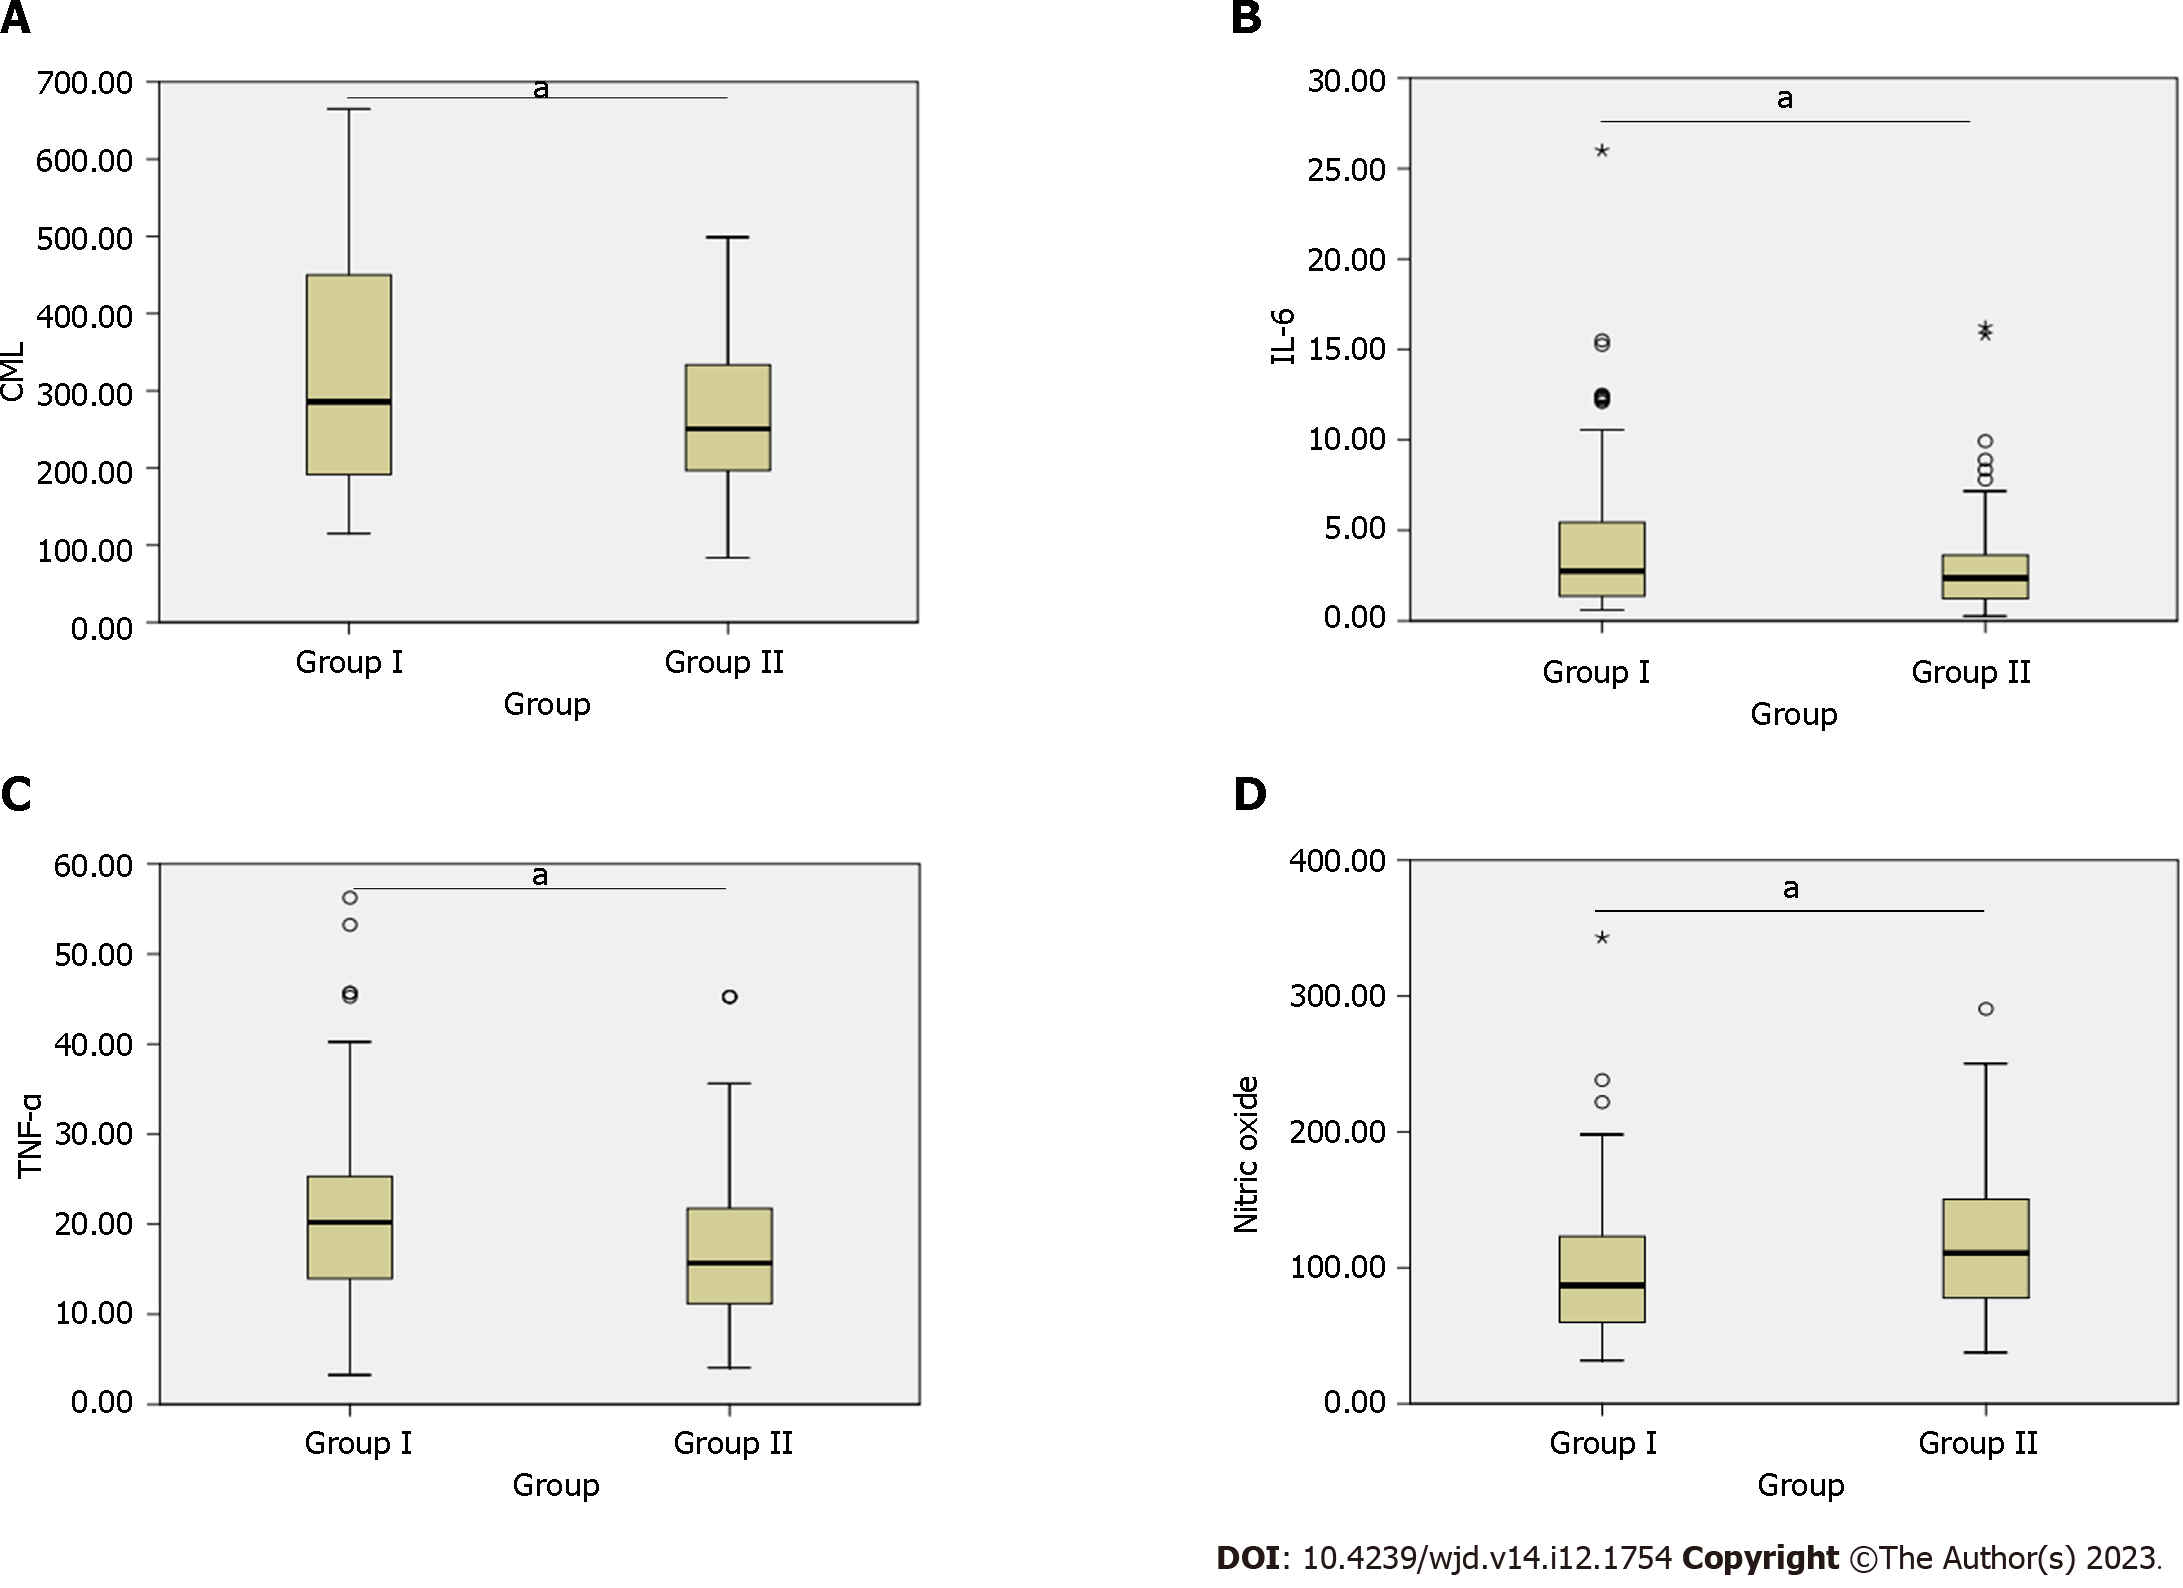
Figure 1 Comparison of serum Nε-carboxymethyl-lysine, interleukin 6, tumor necrosis factor alpha, and nitric oxide between group I and II.
A: Serum Nε-carboxymethyl-lysine (CML) level; B: Serum interleukin-6 (IL-6) level; C: Serum tumor necrosis factor-alpha (TNF-α) level; D: Serum nitric oxide. aBiochemical markers CML, IL-6, TNF-α, and nitric oxide showed a difference between diabetic coronary artery disease patients and non-diabetic coronary artery disease patients. *Significant difference of biochemical markers between Group I: Diabetic coronary artery disease patients; and Group II: Non-diabetic coronary artery disease patients.
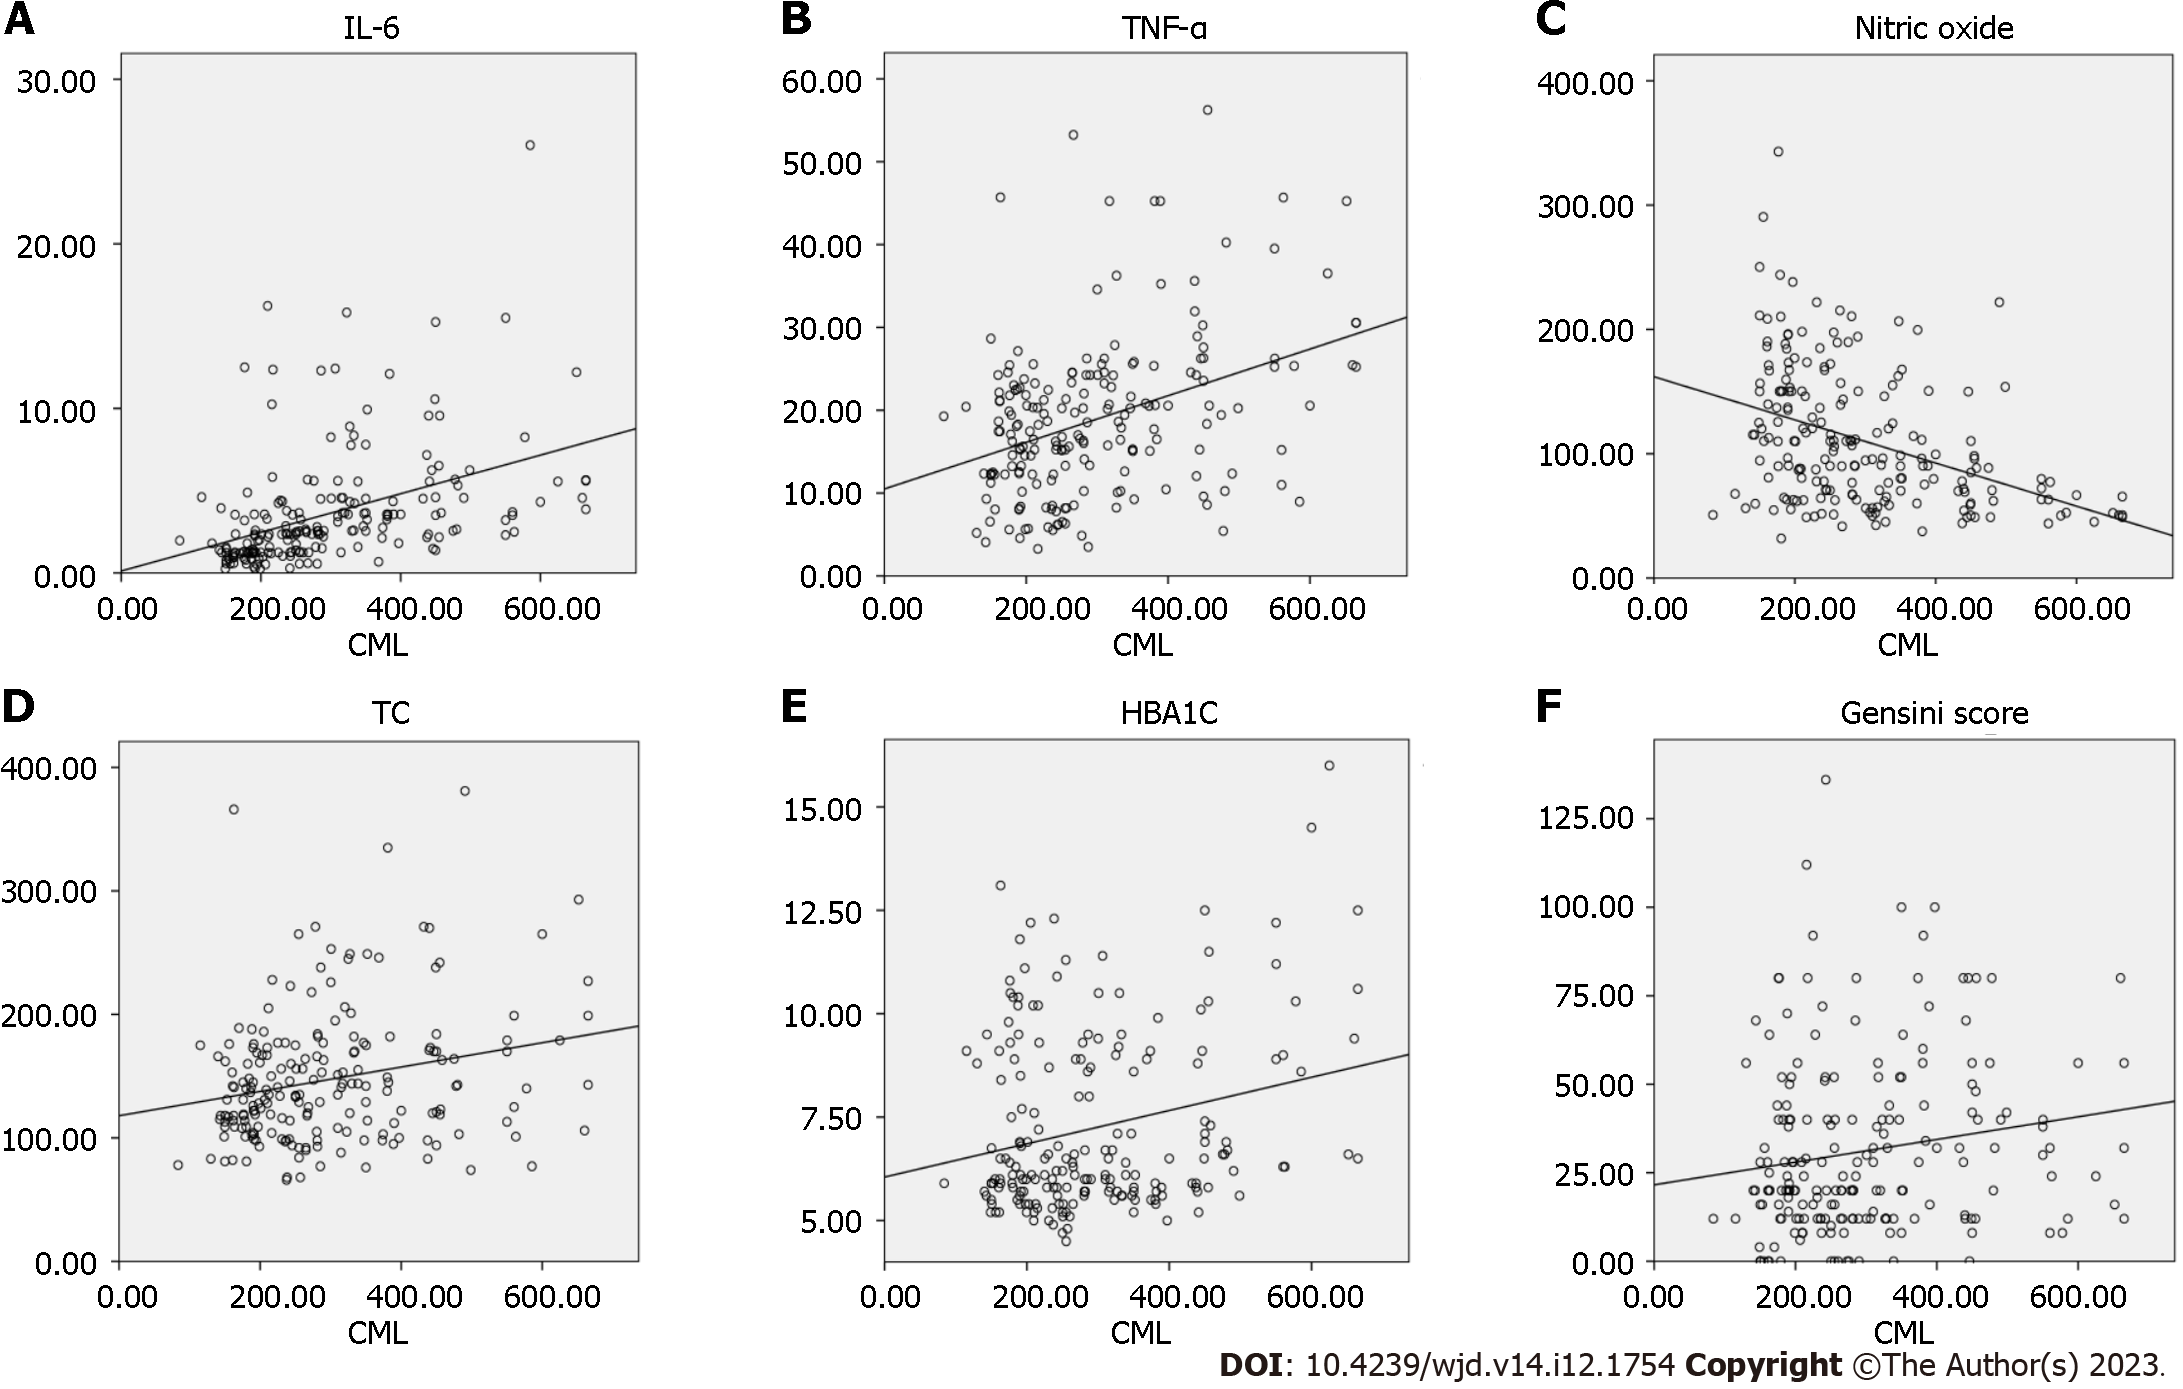
Figure 2 Linear regression analysis of Nε-carboxymethyl-lysine with interleukin 6, tumor necrosis factor alpha, nitric oxide, total cholesterol, glycosylated hemoglobin, and Gensini Score.
A: Regression line between Nε-carboxymethyl-lysine (CML) and interleukin-6 (IL-6); B: Regression line between CML and tumor necrosis factor-alpha (TNF-α); C: Regression line between CML and nitric oxide; D: Regression line between CML and total cholesterol (TC); E: Regression line between CML and glycosylated hemoglobin (HbA1c); F: Regression line between CML and Gensini score.
- Citation: Shrivastav D, Singh DD, Mir R, Mehra P, Mehta V, Dabla PK. Comparative analysis of Nε-carboxymethyl-lysine and inflammatory markers in diabetic and non-diabetic coronary artery disease patients. World J Diabetes 2023; 14(12): 1754-1765
- URL: https://www.wjgnet.com/1948-9358/full/v14/i12/1754.htm
- DOI: https://dx.doi.org/10.4239/wjd.v14.i12.1754


