Copyright
©The Author(s) 2021.
World J Diabetes. Feb 15, 2021; 12(2): 149-157
Published online Feb 15, 2021. doi: 10.4239/wjd.v12.i2.149
Published online Feb 15, 2021. doi: 10.4239/wjd.v12.i2.149
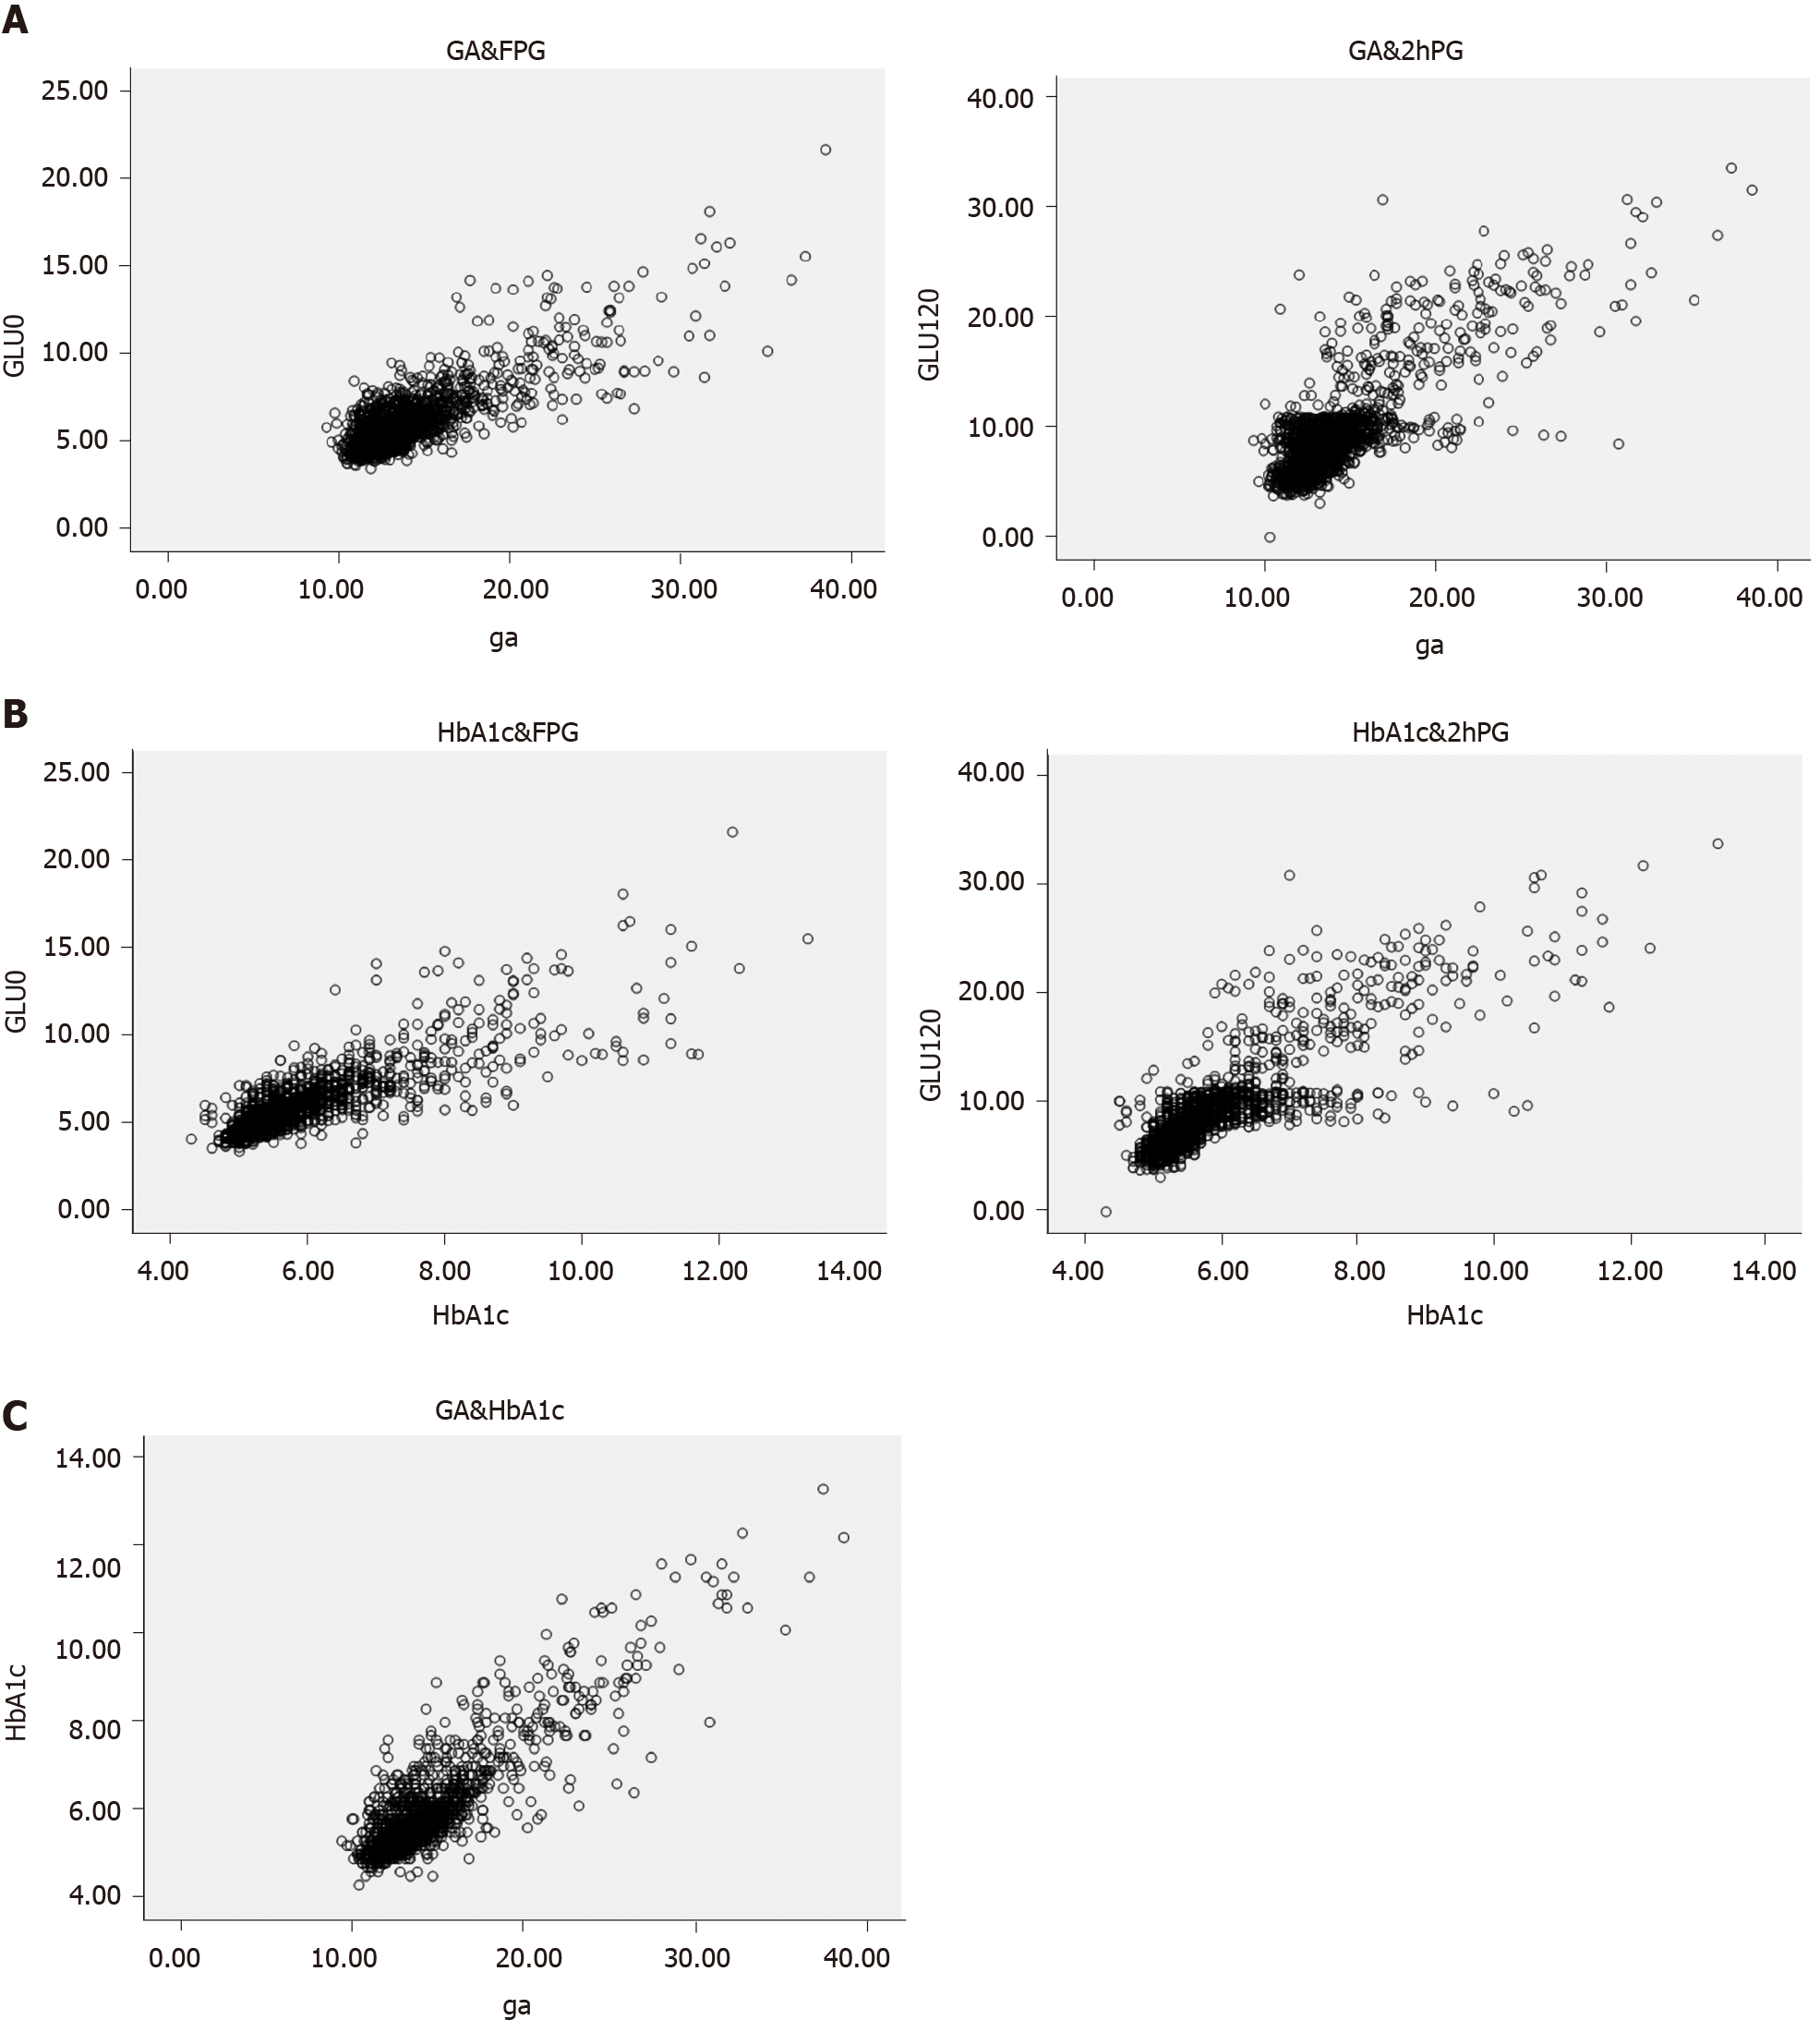
Figure 1 Scatter plots.
A and C: Scatter plots showing the relationships between glycated albumin (GA) with glucose level at 0 min (Glu0) and Glu120 during the oral glucose tolerance test (OGTT) (A), and hemoglobin A1c (HbA1c) (C); B: Scatter plots showing the relationships between HbA1c with Glu0 plasma glucose and Glu120 during the OGTT. FPG: Fasting plasma glucose.
Figure 2 Receiver operating characteristic curve analysis.
The receiver operating characteristic (ROC) curve of hemoglobin A1c (HbA1c) for detecting diabetes was 0.939 [95% confidence interval (CI) 0.924-0.954] and the ROC curve of glycated albumin for detecting diabetes was 0.903 (95%CI 0.879-0.927). Diagonal segments are produced by ties.
- Citation: Li GY, Li HY, Li Q. Use of glycated albumin for the identification of diabetes in subjects from northeast China. World J Diabetes 2021; 12(2): 149-157
- URL: https://www.wjgnet.com/1948-9358/full/v12/i2/149.htm
- DOI: https://dx.doi.org/10.4239/wjd.v12.i2.149


