Copyright
©The Author(s) 2017.
World J Gastrointest Endosc. Jul 16, 2017; 9(7): 310-318
Published online Jul 16, 2017. doi: 10.4253/wjge.v9.i7.310
Published online Jul 16, 2017. doi: 10.4253/wjge.v9.i7.310
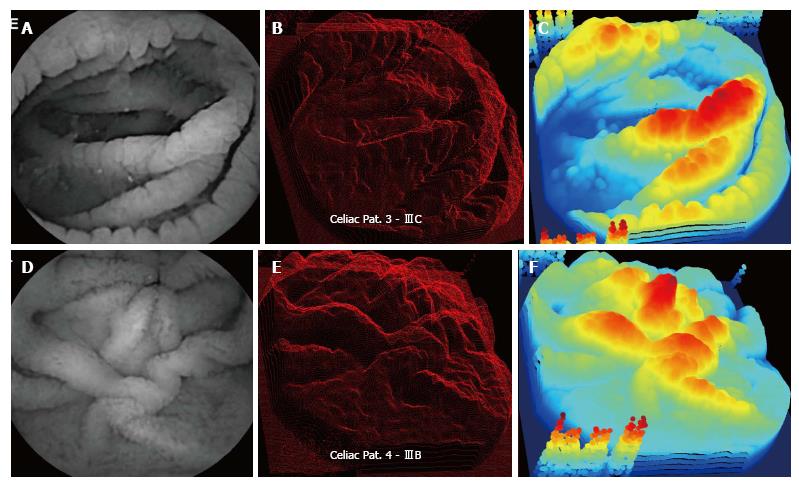
Figure 2 Celiac patient images.
A-C: Patient 3 (Marsh IIIC score); D-F: Patient 4 (Marsh IIIB pathology); A, D: The grayscale endoscopic images; B, E: The three-dimensional projections; C, F: Projections in false color. Colors from blue to yellow, orange, and red represent areas with progressively greater amplitude along the Z-axis (vertical axis). Again note the prominent protrusions evident in the three-dimensional projections of both patients, even though the appearance of texture is somewhat dissimilar in the original two-dimensional endoscopic images.
- Citation: Ciaccio EJ, Bhagat G, Lewis SK, Green PH. Use of shape-from-shading to characterize mucosal topography in celiac disease videocapsule images. World J Gastrointest Endosc 2017; 9(7): 310-318
- URL: https://www.wjgnet.com/1948-5190/full/v9/i7/310.htm
- DOI: https://dx.doi.org/10.4253/wjge.v9.i7.310


