Published online May 16, 2014. doi: 10.4253/wjge.v6.i5.176
Revised: December 31, 2013
Accepted: February 16, 2014
Published online: May 16, 2014
Processing time: 179 Days and 21.2 Hours
AIM: To study the different endocrine cell types in the oxyntic mucosa of patients with irritable bowel syndrome (IBS).
METHODS: Seventy-six patients with IBS were included in the study (62 females and 14 males; mean age 32 years, range 18-55 years), of which 40 also fulfilled the Rome III criteria for functional dyspepsia (FDP). Of the entire IBS cohort, 26 had diarrhea as the predominant symptom (IBS-D), 21 had a mixture of diarrhea and constipation (IBS-M), and 29 had constipation as the predominant symptom (IBS-C). Forty-three age and sex-matched healthy volunteers without any gastrointestinal complaints served as controls. The patients were asked to complete the Birmingham IBS symptom questionnaire. Both the patients and controls underwent a standard gastroscopy, during which three biopsy samples were taken from the corpus. Sections from these biopsy samples were immunostained using the avidin-biotin complex (ABC) method, for ghrelin, serotonin, somatostatin and histamine. The densities of these cell types and immunoreactivity intensities were quantified using computerized image analysis with Olympus cellSens imaging software (version 1.7).
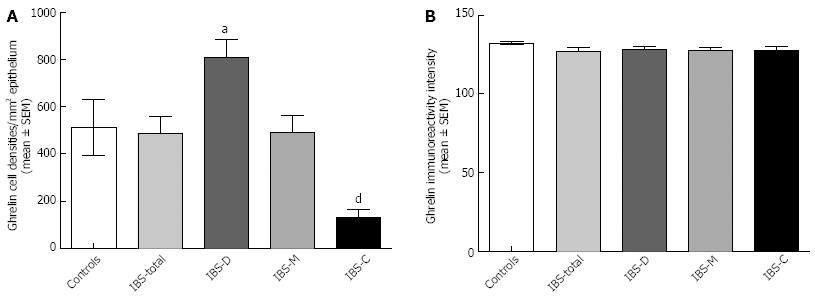
RESULTS: The densities of the ghrelin cells in the control, IBS-total, IBS-D, IBS-M and IBS-C groups were 389 (320, 771), 359 (130, 966), 966 (529, 1154), 358 (120, 966) and 126 (0, 262) cells/mm2, respectively. There was a significant difference between the tested groups (P < 0.0001). Dunn’s multiple comparison test showed that the ghrelin cell density was significantly higher in IBS-D and lower in IBS-C than in the controls (P = 0.03 and 0.0008, respectively). The ghrelin cell density in patients with both IBS and FDP was 489 (130, 966), and in those with IBS only 490 (130, 956). There was no statistical significant difference between these 2 groups of patients (P = 0.9). The immunoreactivity intensity did not differ between any of the groups (P = 0.6). The diarrhea score of the Birmingham IBS symptom questionnaire was significantly positively correlated with ghrelin cell density (r = 0.65; P < 0.0001) and significantly inversely correlated with that of constipation (r = 90.69; P < 0.0001). The densities of the serotonin cells were 63 (51, 82), 51 (25, 115), 120 (69, 128), 74 (46, 123) and 40 (0, 46) cells/mm2 in the control, IBS-total, IBS-D, IBS-M and IBS-C groups, respectively. A statistically significant difference was found between the tested groups (P < 0.0001). Posttest revealed that serotonin cell density was significantly higher in IBS-D and lower in IBS-C than in controls (P = 0.02 and 0.004, respectively), but did not differ in the IBS-total and IBS-M groups from that in controls (P = 0.5 and 0.4, respectively). The serotonin cell density in patients with both IBS and FDP was 62 (25, 115) and in those with IBS only 65 (25, 123). There was no statistically significant difference between these 2 groups of patients (P = 1). The immunoreactivity intensity of serotonin did not differ significantly between any of the groups (P = 0.0.9). The serotonin cell density was significantly positively correlated with the diarrhea score of the Birmingham IBS symptom questionnaire (r = 0.56; P < 0.0001) and significantly inversely correlated with that of constipation (r = 0.51; P < 0.0001). The densities of the somatostatin cells were 97 (72, 126), 72 (0, 206), 29 (0, 80), 46 (0, 103) and 206 (194, 314) cells/mm2 in the control, IBS-total, IBS-D, IBS-M and IBS-C groups, respectively (Figures 7 and 8). There was a statistically significant difference between the controls and the IBS subgroups (P < 0.0001). The density of somatostatin cells was significantly lower in the IBS-D and IBS-M groups but higher in IBS-C patients than in the controls (P < 0.01, P = 0.02, and P = 0.0008, respectively). The somatostatin cell density in patients with both IBS and FDP was 86 (0-194), and in those with IBS only 110 (0-206). There was no statistically significant difference between these 2 groups of patients (P = 0.6). There was no significant difference in somatostatin immunoreactivity intensity between the controls. The diarrhea score of the Birmingham IBS symptom questionnaire was inversely correlated with somatostatin cell density (r = 0.38; P = 0.0007) and was positively correlated with that of constipation (r = 0.64; P < 0.0001).
CONCLUSION: The finding of abnormal endocrine cells in the oxyntic mucosa shows that the endocrine cell disturbances in IBS are not restricted to the intestine. Furthermore, it appears that ghrelin, serotonin and somatostatin in the oxyntic mucosa of the stomach may play an important role in the changing stool habits in IBS through their effects on intestinal motility.
Core tip: There are four endocrine cell types in the oxyntic mucosa of the stomach: ghrelin, serotonin, somatostatin and histamine-containing (enterochromaffin-like) cells. These cells regulate several functions that are disturbed in patients with irritable bowel syndrome (IBS), such as motility and visceral sensation. Of all these cell types, ghrelin cells are the only endocrine cell type that has been studied in IBS patients. The present study investigated all the oxyntic mucosa endocrine cell types and reported several abnormalities that can shed light on the pathophysiology of IBS.
- Citation: El-Salhy M, Gilja OH, Gundersen D, Hausken T. Endocrine cells in the oxyntic mucosa of the stomach in patients with irritable bowel syndrome. World J Gastrointest Endosc 2014; 6(5): 176-185
- URL: https://www.wjgnet.com/1948-5190/full/v6/i5/176.htm
- DOI: https://dx.doi.org/10.4253/wjge.v6.i5.176
The gastrointestinal endocrine cells are scattered among the mucosal epithelial cells lining the gastrointestinal lumen[1-4]. These cells can be divided into several types according to the hormone they produce. They have specialized microvilli that project into the lumen and function as sensors of the luminal contents, and respond by releasing their hormones into the lamina propria, where they act locally (paracrine mode) or via the bloodstream (endocrine mode)[5-14]. These cells interact and integrate with each other, with the enteric nervous system, and with afferent and efferent nerve fibers from the autonomic nervous system[1-4]. There are four types of endocrine cell in the oxyntic mucosa of the stomach: ghrelin, serotonin, somatostatin and histamine-containing (enterochromaffin-like) cells[1,2].
Irritable bowel syndrome (IBS) is a common disorder that affects 10%-20% of the population in the Western world, producing symptoms of abdominal pain/discomfort and altered bowel habits[4]. The findings of laboratory tests, endoscopic examinations and radiological tests are normal in these patients and the diagnosis is based mainly on symptom assessment[4]. Endocrine cell abnormalities have been reported in both the small and large intestines of IBS patients[15-29], but ghrelin cells are the only endocrine cells of the oxyntic mucosa of the stomach that have been investigated thus far[30].
The aim of this study was to determine whether there are abnormalities in the densities and immunoreactivity intensities of all of the endocrine cell types in the oxyntic mucosa of the stomach in a cohort of patients with IBS, including all IBS subtypes: those with diarrhea, constipation or a mixture of both as the predominant symptom (IBS-D, IBS-C and IBS-M, respectively).
Seventy-six patients who fulfilled the Rome III criteria for IBS were included in the study (62 females and 14 males; mean age 32 years, range 18-55 years)[31,32], of which 40 also fulfilled the Rome III criteria for functional dyspepsia (FDP). None of the patients had used proton pump inhibitor medication in the last 6 mo. Of the entire IBS cohort, 26 had IBS-D, 21 had IBS-M, and 29 had IBS-C. All of the patients underwent a complete physical examination and were investigated by way of blood tests to exclude inflammatory, liver, endocrine and any other systemic diseases. Moreover, they were submitted to a colonoscopy with segmental biopsies, which revealed the presence of a normal terminal ileum, colon and rectum in all cases.
Forty-three age and sex-matched healthy volunteers without any gastrointestinal complaints were recruited as controls via local announcements at our hospitals and in the local newspapers (32 females and 11 males; mean age 40 years, range 20-58 years).
The study was approved by the Regional Committee for Medical and Health Research Ethics West, Bergen, Norway. All subjects provided both oral and written consent to participate.
The patients were asked to complete the Birmingham IBS symptom questionnaire, a disease-specific tool for assessing the symptoms of patients with IBS. Its dimensions have good reliability, external validity and sensitivity[33]. The questionnaire comprises 11 questions related to the frequencies of IBS-related symptoms. All of the questions are measured on a 5-point Likert scale. The questionnaire comprises three underlying dimensions: pain, diarrhea and constipation[33].
Both the patients and controls underwent a standard gastroscopy after an overnight fast, during which three biopsy samples were taken from the corpus (major curvature) and two from the antrum. The two antral biopsy samples were used in a rapid urease test for Helicobacter pylori (H. pylori) infection (HelicotecUT Plus, Strong Biotech, Taipei, Taiwan). The corpus biopsy samples were fixed overnight in 4% buffered paraformaldehyde, embedded in paraffin, and then sectioned at a thickness of 5 µm. The sections were stained with hematoxylin-eosin and immunostained using the avidin-biotin complex (ABC) method with a VECTASTAIN ABC kit and 3,3’-diaminobenzidine peroxidase substrate (DAB) as the chromogen (Vector Laboratories, Burlingame, CA, United States). The primary antibodies used were monoclonal mouse anti-N-terminus of human ghrelin (code 2016003, Millipore, Temecula, CA, United States), monoclonal mouse antihuman serotonin (clone 5HT-H209, code M0758, Dako, Glostrup, Denmark), polyclonal rabbit antisynthetic cyclic (1-14) somatostatin (code A0566, Dako), and monoclonal mouse antihistamine-hexamethylene diisocyanate-BSA (code 2273835, Millipore). The sections were incubated at room temperature for 2 h with the primary antibodies diluted to 1:200. They were then washed in phosphate-buffered saline (PBS, pH = 7.4) and incubated with biotinylated swine antimouse IgG (in the case of monoclonal antibodies) or goat antirabbit IgG (in the case of polyclonal antibodies), both diluted to 1:200, for 30 min at room temperature. After washing the slides in PBS, the sections were incubated for 30 min with peroxidase-labeled ABC diluted to 1:100, and then immersed in DAB, followed by counterstaining with hematoxylin.
Quantification of the endocrine cells density and immunoreactivity intensity was achieved using Olympus cellSens imaging software (version 1.7). The microscope (BX 43, Olympus, Oslo, Norway) was equipped with built-in Koehler illumination for transmitted light, a light-intensity manager switch, a high-color-reproductivity LED light source, a 6-V/30-W halogen bulb and a digital camera (DP 26, Olympus). The number of immunoreactive cells, the area of epithelial cells, and the immunoreactivity intensity were measured. The number of immunoreactive cells in each field and the area of epithelium were counted manually, while the immunoreactivity intensity in each field was measured using an automatic threshold setting. A × 40 objective was used, which resulted in each frame (field) on the monitor representing a tissue area of 0.035 mm2. Measurements were made in ten randomly chosen fields in each individual section. Immunostained sections from the IBS patients and controls were coded and mixed, and measurements were made by the same person (M.E.-S.) who was blind to the identity of the patient to whom the tissue sections belonged. The endocrine cell density is expressed as cells/mm2 epithelium and the immunoreactivity intensity is given in arbitrary units (a.u.).
Differences in the gender distribution and the occurrence of H. pylori infection between the patients and controls were tested using Fisher’s exact test. Differences in the age distribution were tested using the Mann-Whitney nonparametric test. Differences between the control, all IBS patients combined (IBS-total), IBS-D, IBS-M and IBS-C groups were tested using the Kruskal-Wallis nonparametric test with Dunn’s posttest. Correlations were analyzed using Spearman’s nonparametric test. The data are presented as median and interquartile (25th and 75th percentile) values and differences with P < 0.05 were considered statistically significant.
The sex and age distributions did not differ significantly between the patients and controls (P = 0.196 and P = 0.360, respectively). The incidence of H. pylori infection did not differ between the patients (n = 3) and controls (n = 2, P = 1.0). The total score for the Birmingham IBS symptom questionnaire for the entire patient cohort (i.e., IBS-total) was 21.5 ± 0.7. The scores on the pain, diarrhea and constipation dimensions were 7.2 ± 0.4, 6.6 ± 0.4, and 7.2 ± 0.4, respectively.
The esophagus was macroscopically normal while the stomach and duodenum were both macroscopically and microscopically normal in both the patients and controls. Immunoreactive cells were found in the stomach oxyntic mucosa of both the patients and controls, and were either basket or flask-shaped, sometimes with a long basal cytoplasmic process. There were insufficient histamine cells in the biopsy samples studied to allow any reliable quantification thereof.
The results of the quantification of different endocrine cell types in the oxyntic mucosa of the stomach in IBS subtypes are given in Table 1.
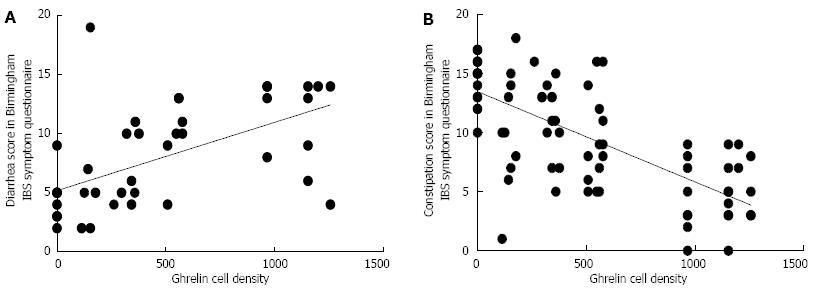
Ghrelin: The densities of the ghrelin cells in the control, IBS-total, IBS-D, IBS-M and IBS-C groups were 389 (320, 771), 359 (130, 966), 966 (529, 1154), 358 (120, 966) and 126 (0, 262) cells/mm2, respectively (Figures 1 and 2). The Kruskal-Wallis test revealed a statistically significant difference between the tested groups (P < 0.0001). Dunn’s multiple comparison test showed that the ghrelin cell density was significantly higher in IBS-D and lower in IBS-C than in the controls (P = 0.03 and 0.0008, respectively). The ghrelin cell density in patients with both IBS and FDP was 489.0 ± 68.1, and in those with IBS only 490.1 ± 73.5. There was no statistically significant difference between these 2 groups of patients (P = 0.9). The immunoreactivity intensity did not differ between any of the groups, being 133 (131, 134), 131 (125, 133), 129 (125, 133), 132 (124, 134) and 130 (123, 133) a.u. in the control, IBS-total, IBS-D, IBS-M and IBS-C groups, respectively (P = 0.6). The diarrhea score of the Birmingham IBS symptom questionnaire was significantly positively correlated with ghrelin cell density (r = 0.65; P < 0.0001) and significantly inversely correlated with that of constipation (r = -0.69; P < 0.0001; Figure 3).
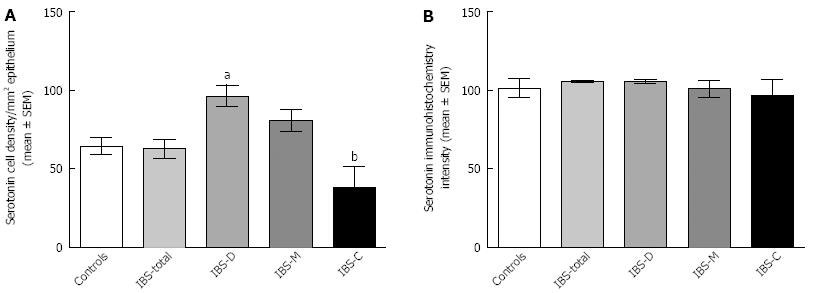
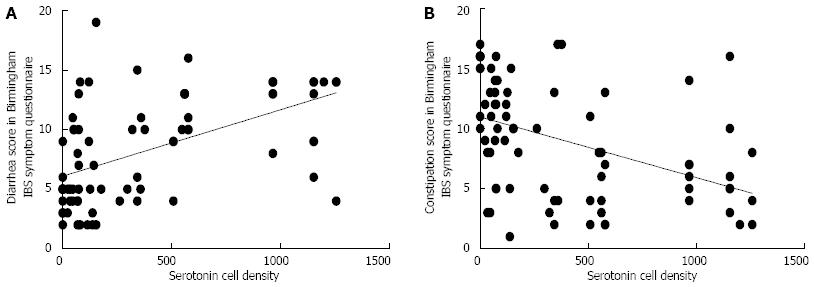
Serotonin: The densities of the serotonin cells were 63 (51, 82), 51 (25, 115), 120 (69, 128), 74 (46, 123) and 40 (0, 46) cells/mm2 in the control, IBS-total, IBS-D, IBS-M and IBS-C groups, respectively. The Kruskal-Wallis test revealed a statistically significant difference between the tested groups (P < 0.0001). Dunn’s posttest revealed that serotonin cell density was significantly higher in IBS-D and lower in IBS-C than in controls (P = 0.02 and 0.004, respectively; Figures 4 and 5), but did not differ in the IBS-total and IBS-M groups from that in controls (P = 0.5 and 0.4, respectively). The serotonin cell density in patients with both IBS and FDP was 62.0 ± 6.5, and in those with IBS only 65.2 ± 9.5. There was no statistically significant difference between these 2 groups of patients (P = 1). The immunoreactivity intensity of serotonin did not differ significantly between any of the groups, being 107 (103, 110), 106 (103, 107), 120 (69, 128), 106 (103, 108) and 107 (101,110) a.u. in the control, IBS-total, IBS-D, IBS-M and IBS-C groups, respectively (P = 0.0.9). The serotonin cell density was significantly positively correlated with the diarrhea score of the Birmingham IBS symptom questionnaire (r = 0.56; P < 0.0001) and significantly inversely correlated with that of constipation (r = -0.51; P < 0.0001; Figure 6).
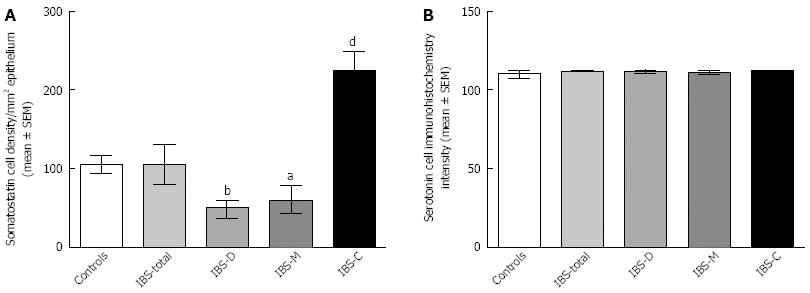
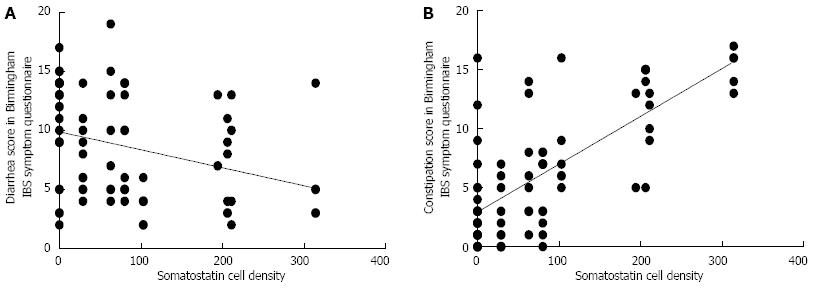
Somatostatin: The densities of the somatostatin cells were 97 (72, 126), 72 (0, 206), 29 (0, 80), 46 (0,103) and 206 (194, 314) cells/mm2 in the control, IBS-total, IBS-D, IBS-M and IBS-C groups, respectively (Figures 7 and 8). The Kruskal-Wallis test indicated a statistically significant difference between the controls and the IBS subgroups (P < 0.0001). The density of somatostatin cells was significantly lower in the IBS-D and IBS-M groups, but higher in IBS-C patients than in the controls (P < 0.01, P = 0.02 and P = 0.0008, respectively). The somatostatin cell density in patients with both IBS and FDP was 86.3 ± 19.3, and in those with IBS only 110.1 ± 24.1. There was no statistical significantly difference between these 2 groups of patients (P = 0.6). There was no significant difference in somatostatin immunoreactivity intensity between the controls (111; 109, 113 a.u.) and the IBS-total (112; 111, 112 a.u.), IBS-D (111; 109, 113 a.u.), IBS-M (113; 110, 113 a.u.), and IBS-C (113; 111, 113 a.u.) patients (P = 0.9). The diarrhea score of the Birmingham IBS symptom questionnaire was inversely correlated with somatostatin cell density (r = -0.38; P = 0.0007) and was positively correlated with that of constipation (r = 0.64; P < 0.0001; Figure 9).
The findings of the present study show that the densities of the three main types of endocrine cells in the oxyntic mucosa of the stomach, namely ghrelin, serotonin and somatostatin cells, are abnormal in IBS patients. However, the nature of these abnormalities differ with the IBS subtype, whereby the densities of the ghrelin and serotonin cells are high in IBS-D but low in IBS-C, and the density of somatostatin cells is low in IBS-D and IBS-M but high in IBS-C. As there is no difference in the endocrine cells densities between patients with IBS/FDP and patients with IBS only, the abnormalities seen in these cells are most probably caused by IBS. The immunoreactivity intensity of ghrelin, serotonin and somatostatin in IBS patients did not differ from that of controls. This indicates that the cellular content of these hormones in IBS patients is not affected relative to controls, which is an important finding given that the cellular content of a hormone reflects its cellular synthesis and release.
Abnormalities in the endocrine cells in both the small and large intestines have been reported in patients with IBS[15-17,20-30,34,35]. In the small intestine, the duodenal cell densities of gastric inhibitory peptide (GIP), secretin, cholecystokinin (CCK) and somatostatin, and the ileal cell densities of serotonin and peptide YY (PYY) were found to be abnormal[16,18]. In the large intestine, colonic serotonin and PYY, and rectal serotonin, PYY, enteroglucagon and somatostatin cell densities have all been found to be affected[17,19,20]. Postinfectious IBS has been reported to be associated with elevated numbers of duodenal CCK cells and rectal serotonin cells, but decreased numbers of duodenal serotonin cells[15,22,24,26,29,35]. The present observation of abnormal densities of gastric endocrine cells suggests that the endocrine cell disturbances occur throughout the gastrointestinal tract of patients with IBS.
The present findings that ghrelin cell density was high in IBS-D and low in IBS-C confirm the results of an earlier study involving another cohort of IBS patients[30]. The present study also found that the ghrelin cell density was not affected in IBS-M. As well as regulating the release of growth hormone and roles in appetite and energy metabolism[36-39], ghrelin accelerates gastric and small and large intestine motility[40-51]. Ghrelin cell density was found in the present study to be strongly positively correlated with the degree of diarrhea and inversely correlated with the degree of constipation. It is thus conceivable that changes in ghrelin cell density play a role in the development of diarrhea and constipation in IBS patients.
Serotonin stimulates colonic motility and accelerates transit through the small and large intestines[52-60]. In the present study, the serotonin cell density was higher in IBS-D and lower in IBS-C compared to healthy controls and unchanged in IBS-M. Moreover, the serotonin cell density was positively correlated with the degree of diarrhea and inversely correlated with the degree of constipation. Therefore, similar to ghrelin, serotonin seems to play a role in the development of both diarrhea and constipation in IBS patients.
Somatostatin inhibits intestinal contraction and gut exocrine and neuroendocrine secretion[2,4]. In the present study, the somatostatin cell density was low in both IBS-D and IBS-M and high in IBS-C. Furthermore, the somatostatin cell density was inversely correlated with the diarrhea score and positively correlated with the constipation score (both assessed by the Birmingham IBS symptom questionnaire). It is therefore possible that changes in the somatostatin cell density also play a considerable role in the development of both diarrhea and constipation in IBS patients.
In conclusion, the results of the present study show that the endocrine cells in the oxyntic mucosa of the stomach in IBS patients are affected and thus that the endocrine cell disturbances observed in IBS are not restricted to the intestine. Furthermore, it appears from the present findings that ghrelin, serotonin and somatostatin in the oxyntic mucosa of the stomach may play an important role in the change in stool habits in IBS via their effects on intestinal motility. These observations shed light on the pathophysiology of IBS and agonists and/or antagonists to the hormones described can probably be used in the near future in the treatment of patients with IBS.
Irritable bowel syndrome (IBS) is a common gastrointestinal disorder. The gastrointestinal endocrine cells are localized among the mucosal epithelial cells lining the gastrointestinal lumen. There are four types of endocrine cell in the oxyntic mucosa of the stomach: ghrelin, serotonin, somatostatin and histamine-containing (enterochromaffin-like) cells. Abnormalities have been reported in both the small and large intestinal endocrine cells of IBS patients. This study was done to determine whether there are abnormalities in the endocrine cell types in the oxyntic mucosa of the stomach in patients with IBS.
The present study showed for the first time that the densities of three of the four endocrine cell types occurring in the oxyntic mucosa of the stomach were abnormal in IBS patients.
The observation that the endocrine cells of oxyntic mucosa were abnormal shows that the endocrine cell disturbances in IBS are not restricted to the intestine. Hence, IBS is not a large intestine disorder. Moreover, the abnormalities observed in the oxyntic mucosa can explain the gastrointestinal dysmotility seen in IBS patients.
Based on the observations made in this study, agonists and antagonists for ghrelin, serotonin and somatostatin may be considered for the treatment of IBS.
This is an interesting pathological study examining the density of enterochromaffin-like cells in the gastric mucosa of IBS patients. Overall, this study was a lot of work and it adds to the body of literature looking at endocrine cell contribution to the pathogenesis of IBS.
P- Reviewers: Amornyotin S, Desilets DJ, Tham TCK S- Editor: Qi Y L- Editor: Roemmele A E- Editor: Zhang DN
| 1. | Moran GW, Leslie FC, Levison SE, Worthington J, McLaughlin JT. Enteroendocrine cells: neglected players in gastrointestinal disorders? Therap Adv Gastroenterol. 2008;1:51-60. |
| 2. | El-Salhy M, Seim I, Chopin L, Gundersen D, Hatlebakk JG, Hausken T. Irritable bowel syndrome: the role of gut neuroendocrine peptides. Front Biosci (Elite Ed). 2012;4:2783-2800. |
| 3. | El-Salhy M, Ostgaard H, Gundersen D, Hatlebakk JG, Hausken T. The role of diet in the pathogenesis and management of irritable bowel syndrome (Review). Int J Mol Med. 2012;29:723-731. |
| 4. | El-Salhy M, Gundersen D, Hatlebakk JG, Hausken T. Irritable bowel syndrome: diagnosis, pathogenesis and treatment options. New York: Nova Science Publishers Inc 2012; . |
| 5. | Sternini C. Taste receptors in the gastrointestinal tract. IV. Functional implications of bitter taste receptors in gastrointestinal chemosensing. Am J Physiol Gastrointest Liver Physiol. 2007;292:G457-G461. |
| 6. | Sternini C, Anselmi L, Rozengurt E. Enteroendocrine cells: a site of ‘taste’ in gastrointestinal chemosensing. Curr Opin Endocrinol Diabetes Obes. 2008;15:73-78. |
| 7. | Raybould HE. Gut chemosensing: interactions between gut endocrine cells and visceral afferents. Auton Neurosci. 2010;153:41-46. |
| 8. | Raybould HE. Nutrient sensing in the gastrointestinal tract: possible role for nutrient transporters. J Physiol Biochem. 2008;64:349-356. |
| 9. | Bertrand PP, Bertrand RL. Serotonin release and uptake in the gastrointestinal tract. Auton Neurosci. 2010;153:47-57. |
| 10. | Akiba Y, Kaunitz JD. Luminal chemosensing in the duodenal mucosa. Acta Physiol (Oxf). 2011;201:77-84. |
| 11. | Steinert RE, Beglinger C. Nutrient sensing in the gut: interactions between chemosensory cells, visceral afferents and the secretion of satiation peptides. Physiol Behav. 2011;105:62-70. |
| 12. | Nakamura E, Hasumura M, Uneyama H, Torii K. Luminal amino acid-sensing cells in gastric mucosa. Digestion. 2011;83 Suppl 1:13-18. |
| 13. | Tolhurst G, Reimann F, Gribble FM. Intestinal sensing of nutrients. Handb Exp Pharmacol. 2012;309-335. |
| 14. | Mace OJ, Schindler M, Patel S. The regulation of K- and L-cell activity by GLUT2 and the calcium-sensing receptor CasR in rat small intestine. J Physiol. 2012;590:2917-2936. |
| 15. | Dizdar V, Spiller R, Singh G, Hanevik K, Gilja OH, El-Salhy M, Hausken T. Relative importance of abnormalities of CCK and 5-HT (serotonin) in Giardia-induced post-infectious irritable bowel syndrome and functional dyspepsia. Aliment Pharmacol Ther. 2010;31:883-891. |
| 16. | El-Salhy M, Vaali K, Dizdar V, Hausken T. Abnormal small-intestinal endocrine cells in patients with irritable bowel syndrome. Dig Dis Sci. 2010;55:3508-3513. |
| 17. | El-Salhy M, Gundersen D, Ostgaard H, Lomholt-Beck B, Hatlebakk JG, Hausken T. Low densities of serotonin and peptide YY cells in the colon of patients with irritable bowel syndrome. Dig Dis Sci. 2012;57:873-878. |
| 18. | El-Salhy M, Gilja OH, Gundersen D, Hatlebakk JG, Hausken T. Endocrine cells in the ileum of patients with irritable bowel syndrome. World J Gastroenterol. 2014;20:2383-2391. |
| 19. | El-Salhy M, Gundersen D, Hatlebakk JG, Gilja OH, Hausken T. Abnormal rectal endocrine cells in patients with irritable bowel syndrome. Regul Pept. 2014;188:60-65. |
| 20. | Coates MD, Mahoney CR, Linden DR, Sampson JE, Chen J, Blaszyk H, Crowell MD, Sharkey KA, Gershon MD, Mawe GM. Molecular defects in mucosal serotonin content and decreased serotonin reuptake transporter in ulcerative colitis and irritable bowel syndrome. Gastroenterology. 2004;126:1657-1664. |
| 21. | Wang SH, Dong L, Luo JY, Gong J, Li L, Lu XL, Han SP. Decreased expression of serotonin in the jejunum and increased numbers of mast cells in the terminal ileum in patients with irritable bowel syndrome. World J Gastroenterol. 2007;13:6041-6047. |
| 22. | Lee KJ, Kim YB, Kim JH, Kwon HC, Kim DK, Cho SW. The alteration of enterochromaffin cell, mast cell, and lamina propria T lymphocyte numbers in irritable bowel syndrome and its relationship with psychological factors. J Gastroenterol Hepatol. 2008;23:1689-1694. |
| 23. | Park JH, Rhee PL, Kim G, Lee JH, Kim YH, Kim JJ, Rhee JC, Song SY. Enteroendocrine cell counts correlate with visceral hypersensitivity in patients with diarrhoea-predominant irritable bowel syndrome. Neurogastroenterol Motil. 2006;18:539-546. |
| 24. | Kim HS, Lim JH, Park H, Lee SI. Increased immunoendocrine cells in intestinal mucosa of postinfectious irritable bowel syndrome patients 3 years after acute Shigella infection--an observation in a small case control study. Yonsei Med J. 2010;51:45-51. |
| 25. | Dunlop SP, Coleman NS, Blackshaw E, Perkins AC, Singh G, Marsden CA, Spiller RC. Abnormalities of 5-hydroxytryptamine metabolism in irritable bowel syndrome. Clin Gastroenterol Hepatol. 2005;3:349-357. |
| 26. | Dunlop SP, Jenkins D, Neal KR, Spiller RC. Relative importance of enterochromaffin cell hyperplasia, anxiety, and depression in postinfectious IBS. Gastroenterology. 2003;125:1651-1659. |
| 27. | El-Salhy M, Lomholt-Beck B, Hausken T. Chromogranin A as a possible tool in the diagnosis of irritable bowel syndrome. Scand J Gastroenterol. 2010;45:1435-1439. |
| 28. | El-Salhy M, Mazzawi T, Gundersen D, Hausken T. Chromogranin A cell density in the rectum of patients with irritable bowel syndrome. Mol Med Rep. 2012;6:1223-1225. |
| 29. | Spiller RC, Jenkins D, Thornley JP, Hebden JM, Wright T, Skinner M, Neal KR. Increased rectal mucosal enteroendocrine cells, T lymphocytes, and increased gut permeability following acute Campylobacter enteritis and in post-dysenteric irritable bowel syndrome. Gut. 2000;47:804-811. |
| 30. | El-Salhy M, Lillebø E, Reinemo A, Salmelid L. Ghrelin in patients with irritable bowel syndrome. Int J Mol Med. 2009;23:703-707. |
| 31. | Longstreth GF, Thompson WG, Chey WD, Houghton LA, Mearin F, Spiller RC. Functional bowel disorders. Gastroenterology. 2006;130:1480-1491. |
| 32. | Spiller R, Aziz Q, Creed F, Emmanuel A, Houghton L, Hungin P, Jones R, Kumar D, Rubin G, Trudgill N. Guidelines on the irritable bowel syndrome: mechanisms and practical management. Gut. 2007;56:1770-1798. |
| 33. | Roalfe AK, Roberts LM, Wilson S. Evaluation of the Birmingham IBS symptom questionnaire. BMC Gastroenterol. 2008;8:30. |
| 34. | El-Salhy M, Gundersen D, Gilja OH, Hatlebakk JG, Hausken T. Is irritable bowel syndrome an organic disorder? World J Gastroenterol. 2014;20:384-400. |
| 35. | Wang LH, Fang XC, Pan GZ. Bacillary dysentery as a causative factor of irritable bowel syndrome and its pathogenesis. Gut. 2004;53:1096-1101. |
| 36. | Masuda Y, Tanaka T, Inomata N, Ohnuma N, Tanaka S, Itoh Z, Hosoda H, Kojima M, Kangawa K. Ghrelin stimulates gastric acid secretion and motility in rats. Biochem Biophys Res Commun. 2000;276:905-908. |
| 37. | Fujino K, Inui A, Asakawa A, Kihara N, Fujimura M, Fujimiya M. Ghrelin induces fasted motor activity of the gastrointestinal tract in conscious fed rats. J Physiol. 2003;550:227-240. |
| 38. | Wren AM, Seal LJ, Cohen MA, Brynes AE, Frost GS, Murphy KG, Dhillo WS, Ghatei MA, Bloom SR. Ghrelin enhances appetite and increases food intake in humans. J Clin Endocrinol Metab. 2001;86:5992. |
| 39. | Hosoda H, Kojima M, Kangawa K. Ghrelin and the regulation of food intake and energy balance. Mol Interv. 2002;2:494-503. |
| 40. | Asakawa A, Ataka K, Fujino K, Chen CY, Kato I, Fujimiya M, Inui A. Ghrelin family of peptides and gut motility. J Gastroenterol Hepatol. 2011;26 Suppl 3:73-74. |
| 41. | Dornonville de la Cour C, Lindström E, Norlén P, Håkanson R. Ghrelin stimulates gastric emptying but is without effect on acid secretion and gastric endocrine cells. Regul Pept. 2004;120:23-32. |
| 42. | Fukuda H, Mizuta Y, Isomoto H, Takeshima F, Ohnita K, Ohba K, Omagari K, Taniyama K, Kohno S. Ghrelin enhances gastric motility through direct stimulation of intrinsic neural pathways and capsaicin-sensitive afferent neurones in rats. Scand J Gastroenterol. 2004;39:1209-1214. |
| 43. | Levin F, Edholm T, Schmidt PT, Grybäck P, Jacobsson H, Degerblad M, Höybye C, Holst JJ, Rehfeld JF, Hellström PM. Ghrelin stimulates gastric emptying and hunger in normal-weight humans. J Clin Endocrinol Metab. 2006;91:3296-3302. |
| 44. | Edholm T, Levin F, Hellström PM, Schmidt PT. Ghrelin stimulates motility in the small intestine of rats through intrinsic cholinergic neurons. Regul Pept. 2004;121:25-30. |
| 45. | Tack J, Depoortere I, Bisschops R, Delporte C, Coulie B, Meulemans A, Janssens J, Peeters T. Influence of ghrelin on interdigestive gastrointestinal motility in humans. Gut. 2006;55:327-333. |
| 46. | Ariga H, Tsukamoto K, Chen C, Mantyh C, Pappas TN, Takahashi T. Endogenous acyl ghrelin is involved in mediating spontaneous phase III-like contractions of the rat stomach. Neurogastroenterol Motil. 2007;19:675-680. |
| 47. | Ariga H, Nakade Y, Tsukamoto K, Imai K, Chen C, Mantyh C, Pappas TN, Takahashi T. Ghrelin accelerates gastric emptying via early manifestation of antro-pyloric coordination in conscious rats. Regul Pept. 2008;146:112-116. |
| 48. | Tümer C, Oflazoğlu HD, Obay BD, Kelle M, Taşdemir E. Effect of ghrelin on gastric myoelectric activity and gastric emptying in rats. Regul Pept. 2008;146:26-32. |
| 49. | Tebbe JJ, Mronga S, Tebbe CG, Ortmann E, Arnold R, Schäfer MK. Ghrelin-induced stimulation of colonic propulsion is dependent on hypothalamic neuropeptide Y1- and corticotrophin-releasing factor 1 receptor activation. J Neuroendocrinol. 2005;17:570-576. |
| 50. | Seim I, El-Salhy M, Hausken T, Gundersen D, Chopin L. Ghrelin and the brain-gut axis as a pharmacological target for appetite control. Curr Pharm Des. 2012;18:768-775. |
| 51. | El-Salhy M. Ghrelin in gastrointestinal diseases and disorders: a possible role in the pathophysiology and clinical implications (review). Int J Mol Med. 2009;24:727-732. |
| 52. | Gershon MD, Tack J. The serotonin signaling system: from basic understanding to drug development for functional GI disorders. Gastroenterology. 2007;132:397-414. |
| 53. | Tack JF, Janssens J, Vantrappen G, Wood JD. Actions of 5-hydroxytryptamine on myenteric neurons in guinea pig gastric antrum. Am J Physiol. 1992;263:G838-G846. |
| 54. | Michel K, Sann H, Schaaf C, Schemann M. Subpopulations of gastric myenteric neurons are differentially activated via distinct serotonin receptors: projection, neurochemical coding, and functional implications. J Neurosci. 1997;17:8009-8017. |
| 55. | Tack J, Coulie B, Wilmer A, Andrioli A, Janssens J. Influence of sumatriptan on gastric fundus tone and on the perception of gastric distension in man. Gut. 2000;46:468-473. |
| 56. | Gershon MD. Plasticity in serotonin control mechanisms in the gut. Curr Opin Pharmacol. 2003;3:600-607. |
| 57. | Gershon MD. 5-Hydroxytryptamine (serotonin) in the gastrointestinal tract. Curr Opin Endocrinol Diabetes Obes. 2013;20:14-21. |
| 58. | Gershon MD. Serotonin is a sword and a shield of the bowel: serotonin plays offense and defense. Trans Am Clin Climatol Assoc. 2012;123:268-80; discussion 280. |
| 59. | Gershon MD. Review article: roles played by 5-hydroxytryptamine in the physiology of the bowel. Aliment Pharmacol Ther. 1999;13 Suppl 2:15-30. |
| 60. | Gershon MD, Wade PR, Kirchgessner AL, Tamir H. 5-HT receptor subtypes outside the central nervous system. Roles in the physiology of the gut. Neuropsychopharmacology. 1990;3:385-395. |


