
















Copyright: ©Author(s) 2026.
World J Gastrointest Endosc. Aug 16, 2026; 18(8): 122124
Published online Aug 16, 2026. doi: 10.4253/wjge.122124
Published online Aug 16, 2026. doi: 10.4253/wjge.122124
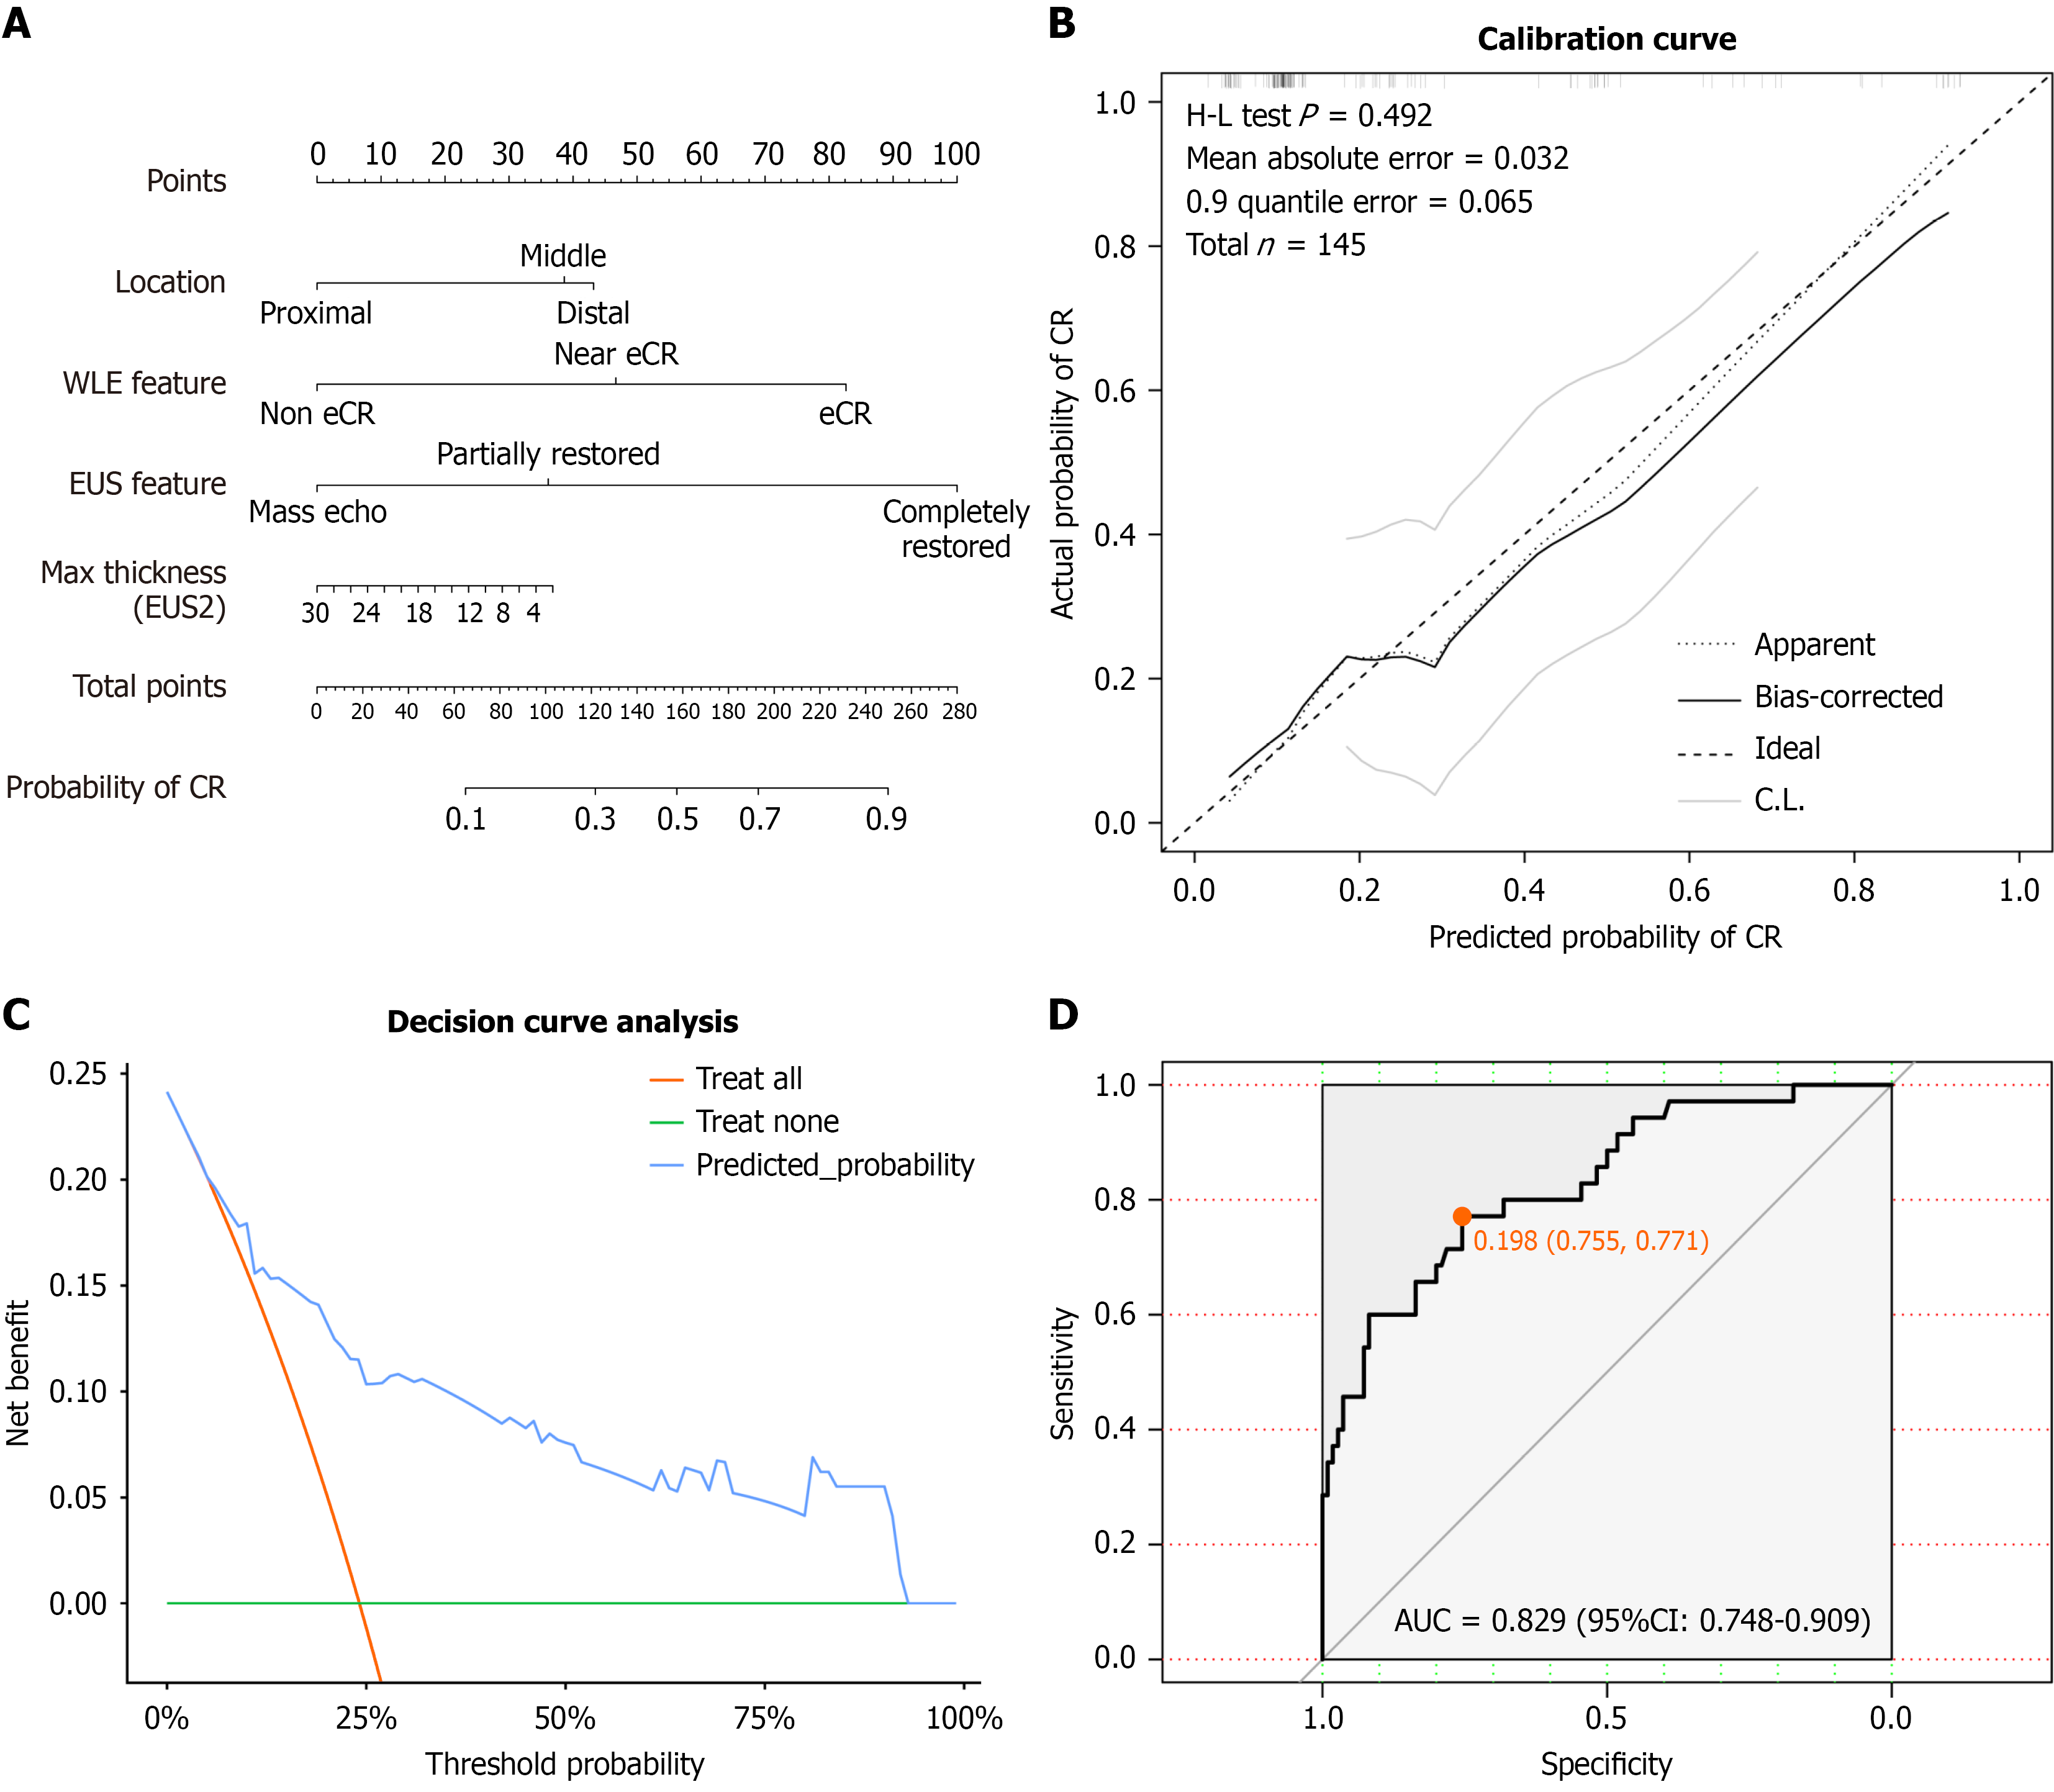
Figure 5 Development and validation of the predictive nomogram for complete response.
A: Nomogram incorporating clinical location, whitelight endoscopy, and endoscopic ultrasound feature to estimate the individualized probability of complete response; B: Calibration curve demonstrating excellent agreement between the nomogram-predicted and actual observed probabilities; C: Decision curve analysis showing that the nomogram provides a superior clinical net benefit across a wide range of threshold probabilities compared to default strategies; D: Receiver operating characteristic curve for the nomogram predicting complete response. CR: Complete response; WLE: White light endoscopy; EUS: Endoscopic ultrasound; H-L: Hosmer-Lemeshow; AUC: Area under the curve; CI: Confidence interval.
- Citation: Chi J, Weng J, Li WH, Bai KH, Yang R, Zhang LJ, Fan WH, Wu XJ. From surface to depth: Combining white-light and ultrasound endoscopy to predict complete response in rectal cancer. World J Gastrointest Endosc 2026; 18(8): 122124
- URL: https://www.wjgnet.com/1948-5190/full/v18/i8/122124.htm
- DOI: https://dx.doi.org/10.4253/wjge.122124