
















Copyright: ©Author(s) 2026.
World J Gastrointest Endosc. Aug 16, 2026; 18(8): 122124
Published online Aug 16, 2026. doi: 10.4253/wjge.122124
Published online Aug 16, 2026. doi: 10.4253/wjge.122124
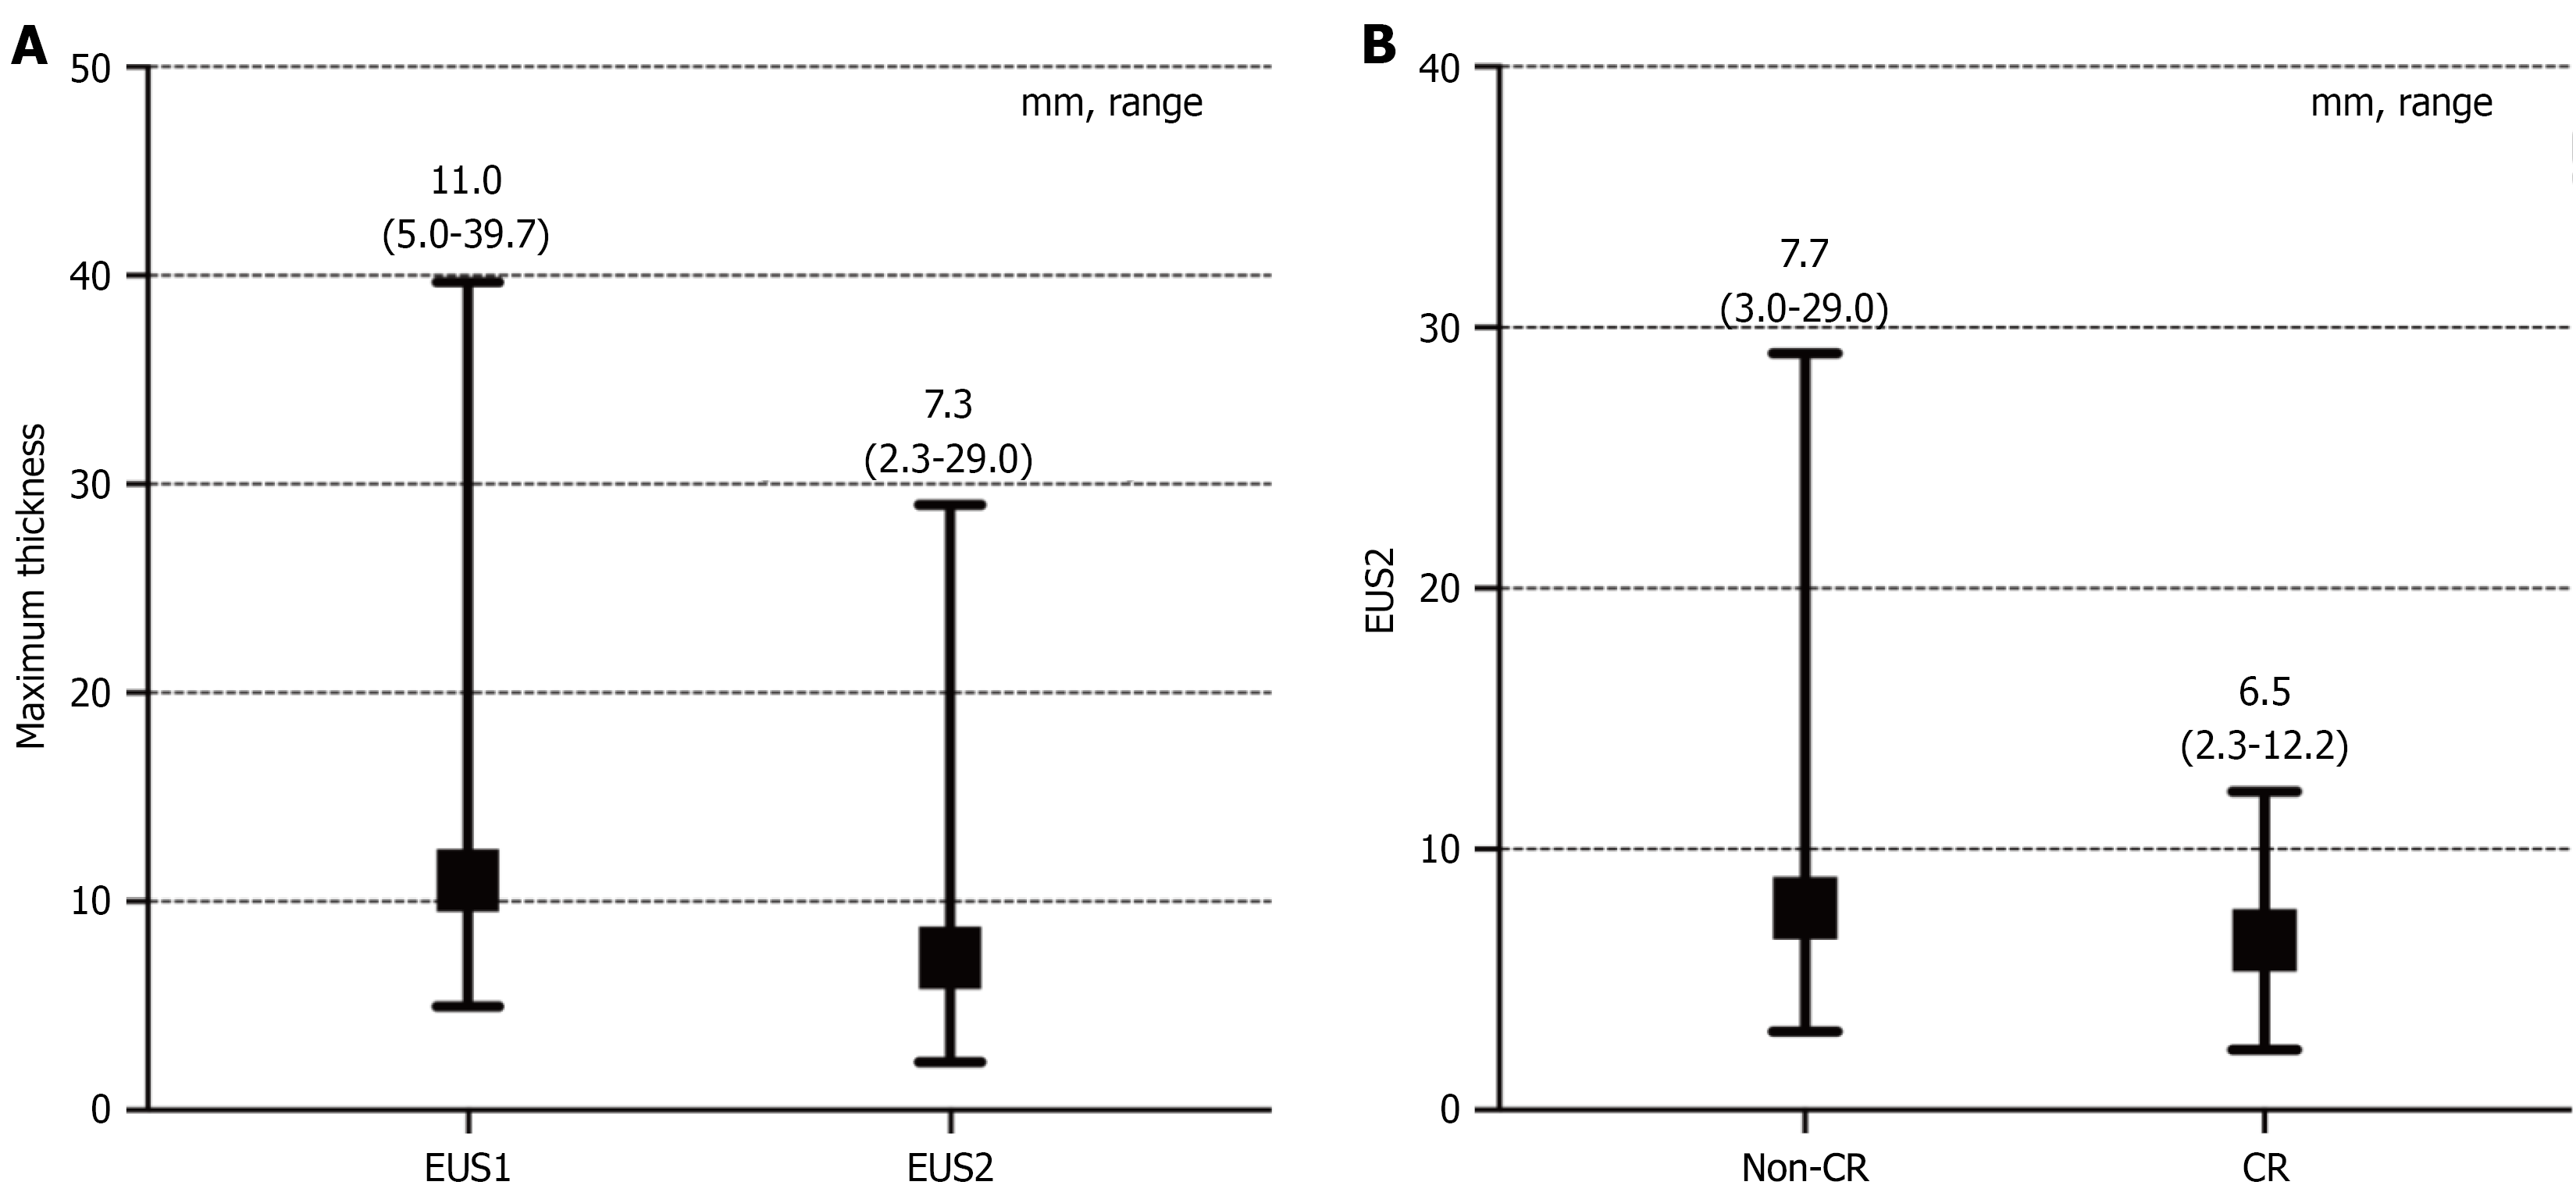
Figure 4 Changes in maximum tumor thickness measured by endoscopic ultrasound.
Data are presented as the median (range) in millimeters (mm) (n = 73). A: Comparison of tumor thickness at baseline (EUS1) and post-treatment (EUS2); B: Comparison of post-treatment tumor thickness (EUS2) between the complete response (CR) and non-CR groups. CR: Complete response; EUS: Endoscopic ultrasound.
- Citation: Chi J, Weng J, Li WH, Bai KH, Yang R, Zhang LJ, Fan WH, Wu XJ. From surface to depth: Combining white-light and ultrasound endoscopy to predict complete response in rectal cancer. World J Gastrointest Endosc 2026; 18(8): 122124
- URL: https://www.wjgnet.com/1948-5190/full/v18/i8/122124.htm
- DOI: https://dx.doi.org/10.4253/wjge.122124