
















Copyright: ©Author(s) 2026.
World J Gastrointest Endosc. Aug 16, 2026; 18(8): 118718
Published online Aug 16, 2026. doi: 10.4253/wjge.118718
Published online Aug 16, 2026. doi: 10.4253/wjge.118718
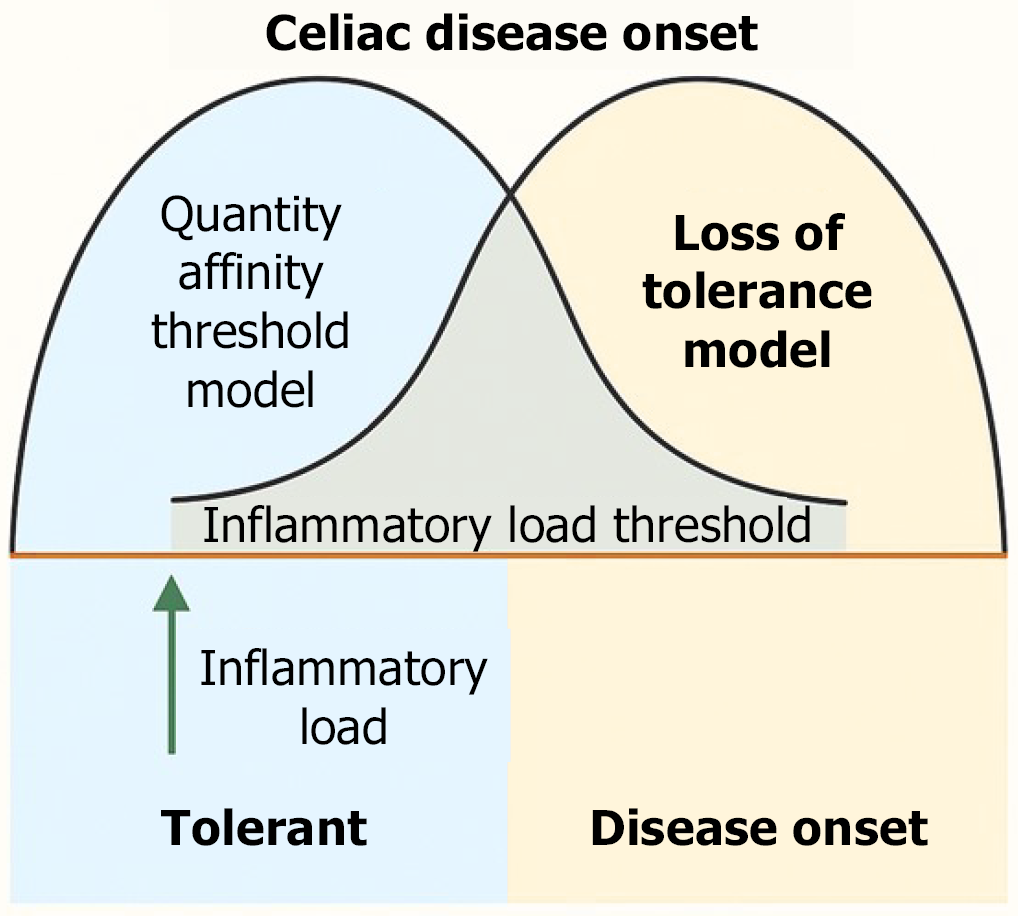
Figure 5 A model of celiac disease onset.
The top panel shows that various combinations of inflammatory load thresholds for the quantitative/affinity vs loss of tolerance models may occur. As inflammatory load increases in the tolerant individual (lower panel), regardless of the threshold levels (top panel) the balance will be tipped toward disease onset, so that oral tolerance may be breached.
- Citation: Ciaccio EJ, Wolf RL, Ciacci C, Green PH, Acharya UR. Celiac disease onset and inflammatory milieu. World J Gastrointest Endosc 2026; 18(8): 118718
- URL: https://www.wjgnet.com/1948-5190/full/v18/i8/118718.htm
- DOI: https://dx.doi.org/10.4253/wjge.118718