
















Copyright: ©Author(s) 2026.
World J Gastrointest Endosc. Nov 16, 2026; 18(11): 126001
Published online Nov 16, 2026. doi: 10.4253/wjge.126001
Published online Nov 16, 2026. doi: 10.4253/wjge.126001
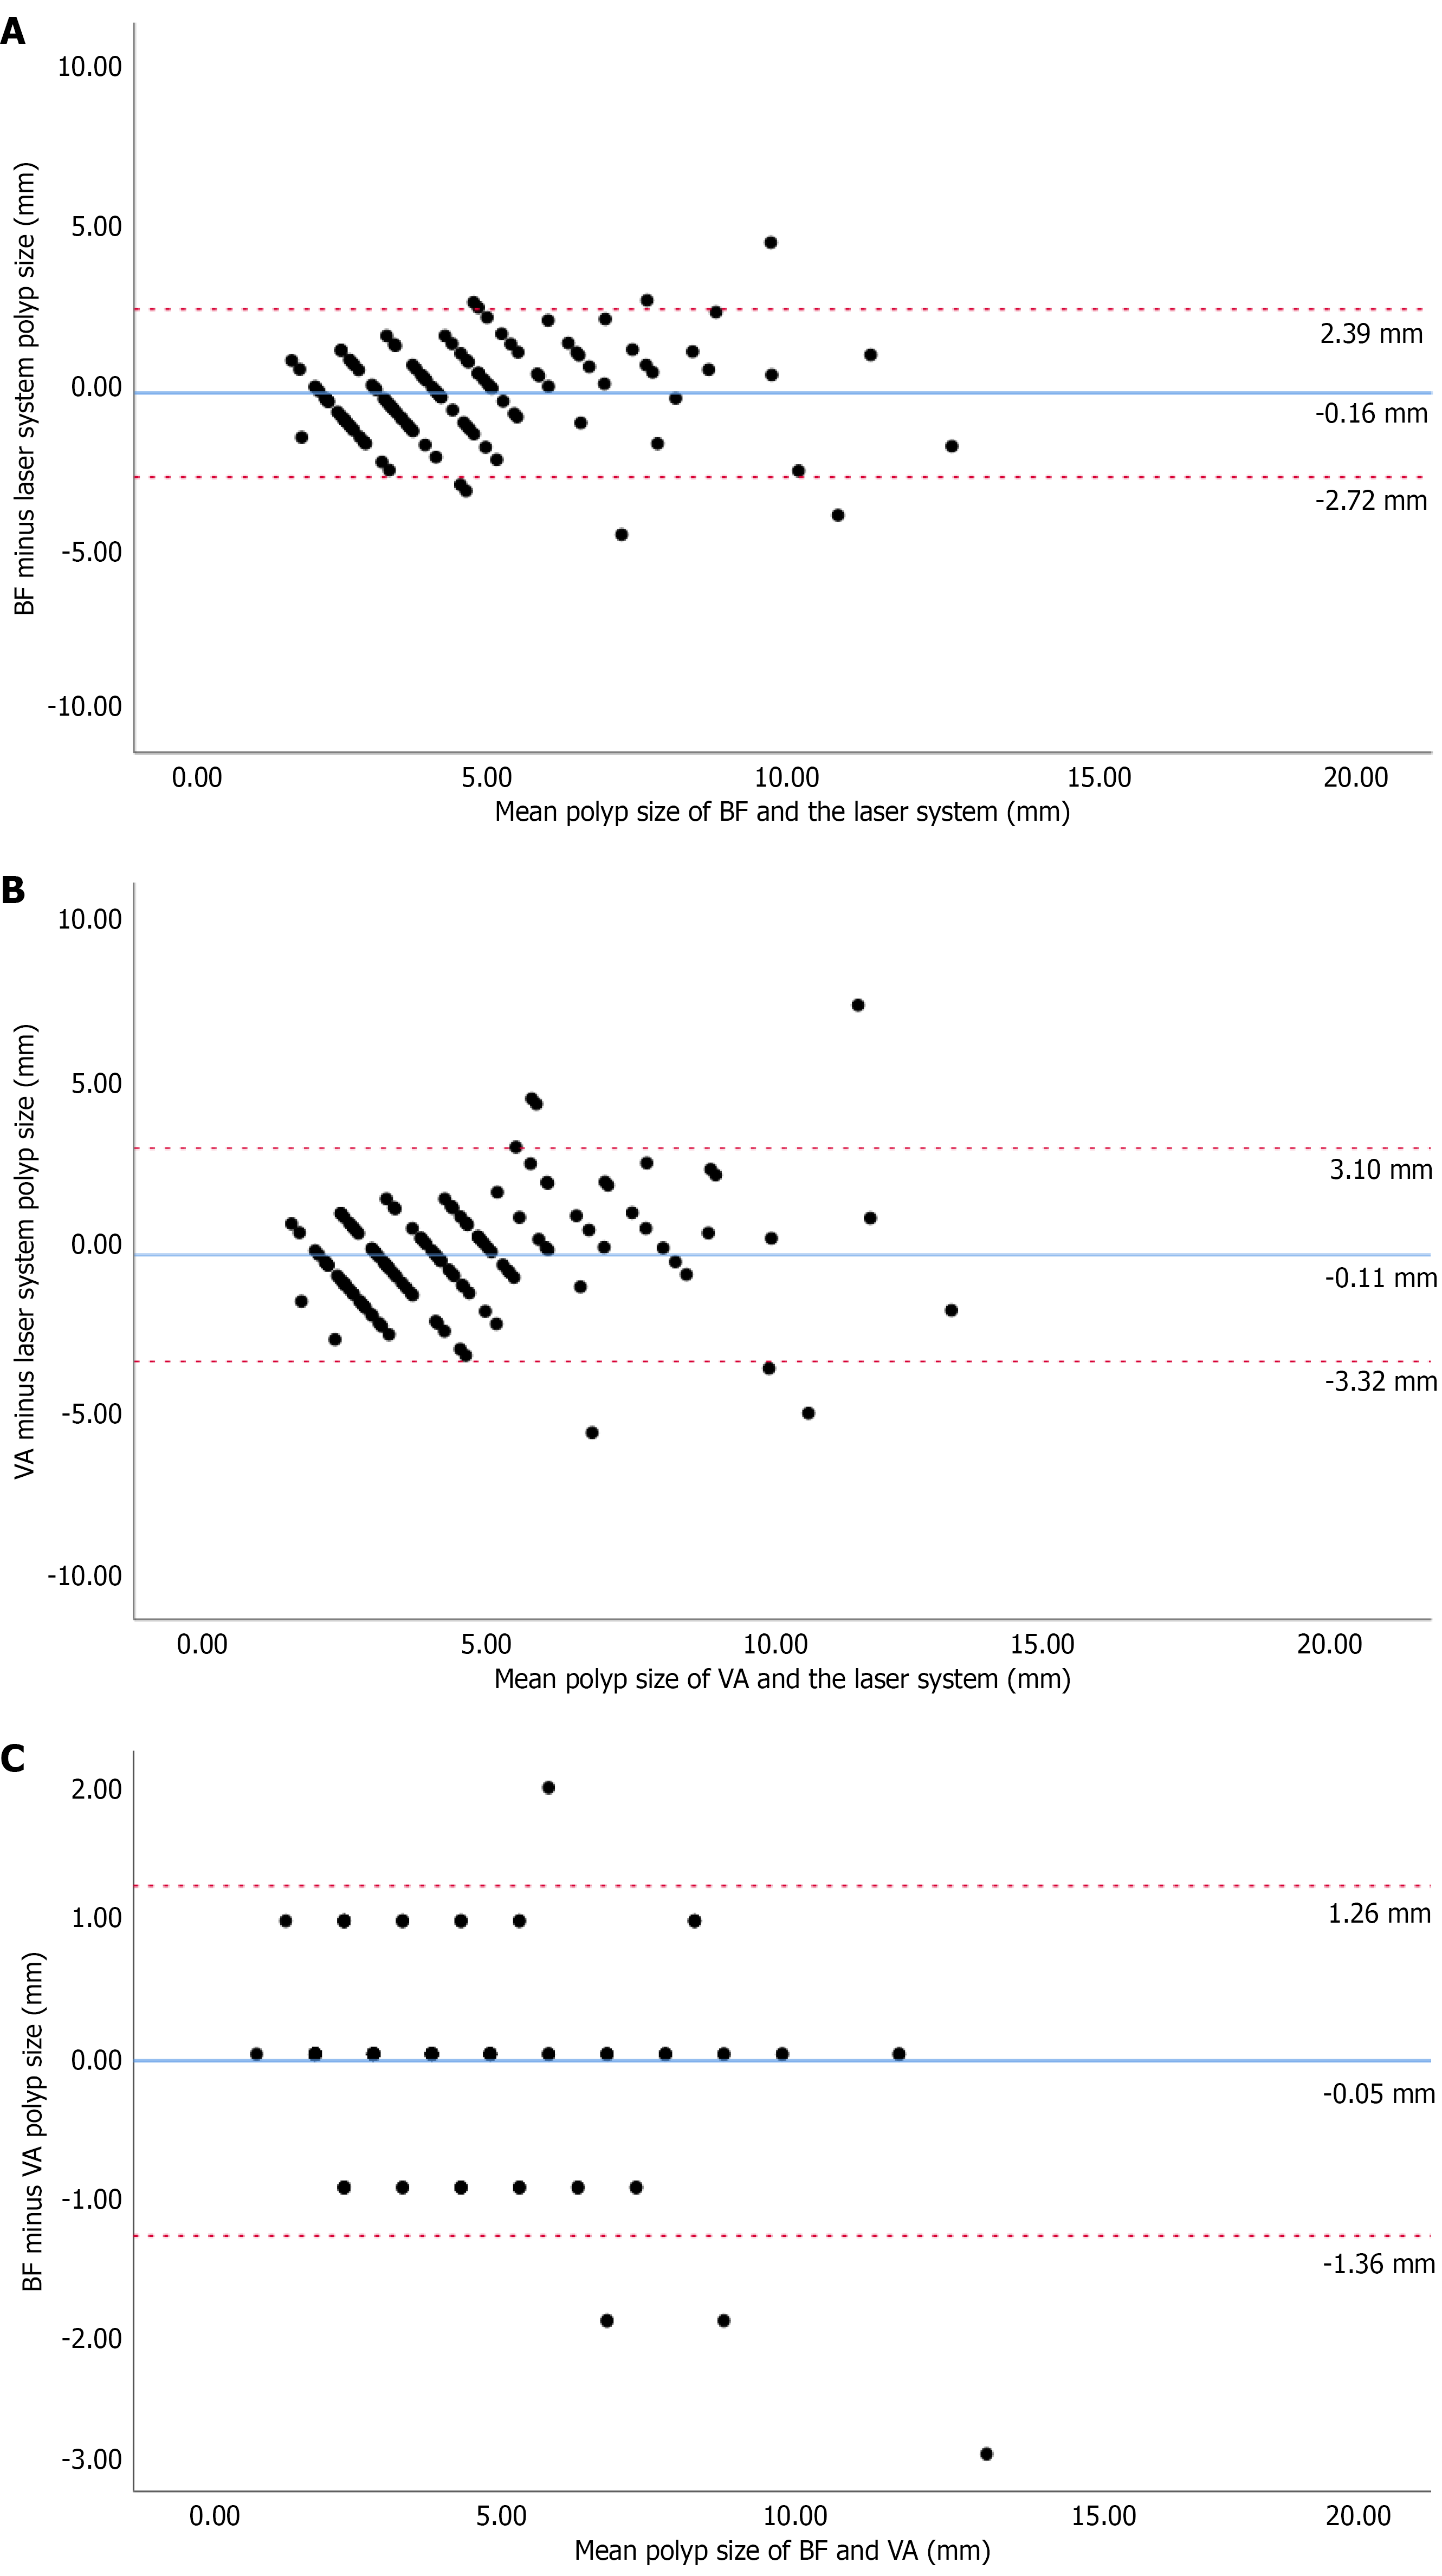
Figure 3 Bland-Altman plots.
A: Size differences (in millimeters) between biopsy forceps and the laser-based measurement system; B: Size differences (in millimeters) between visual assessment and the laser-based measurement system; C: Size differences (in millimeters) between biopsy forceps and visual assessment. Each point in the plots represents one polyp measurement and shows the difference in size (in millimeters) for all 137 polyps. The blue line represents the mean difference in millimeters between two measurement techniques. The red lines indicate the upper and lower limits of agreement, which is the range containing the most size differences between two measurement techniques. BF: Biopsy forceps; VA: Visual assessment.
- Citation: Gerritsen D, van Riswijk MLM, Rex DK, Gross SA, Goldstein O, Cohen NA, Odeh S, Ben-Ami Shor D, Koch AD, Rijckborst V, Siersema PD. Colorectal polyp size measurement comparing biopsy forceps with visual assessment during real-time colonoscopy: A prospective, multicenter, international study. World J Gastrointest Endosc 2026; 18(11): 126001
- URL: https://www.wjgnet.com/1948-5190/full/v18/i11/126001.htm
- DOI: https://dx.doi.org/10.4253/wjge.126001