
















Copyright: ©Author(s) 2026.
World J Gastrointest Endosc. Oct 16, 2026; 18(10): 125564
Published online Oct 16, 2026. doi: 10.4253/wjge.125564
Published online Oct 16, 2026. doi: 10.4253/wjge.125564
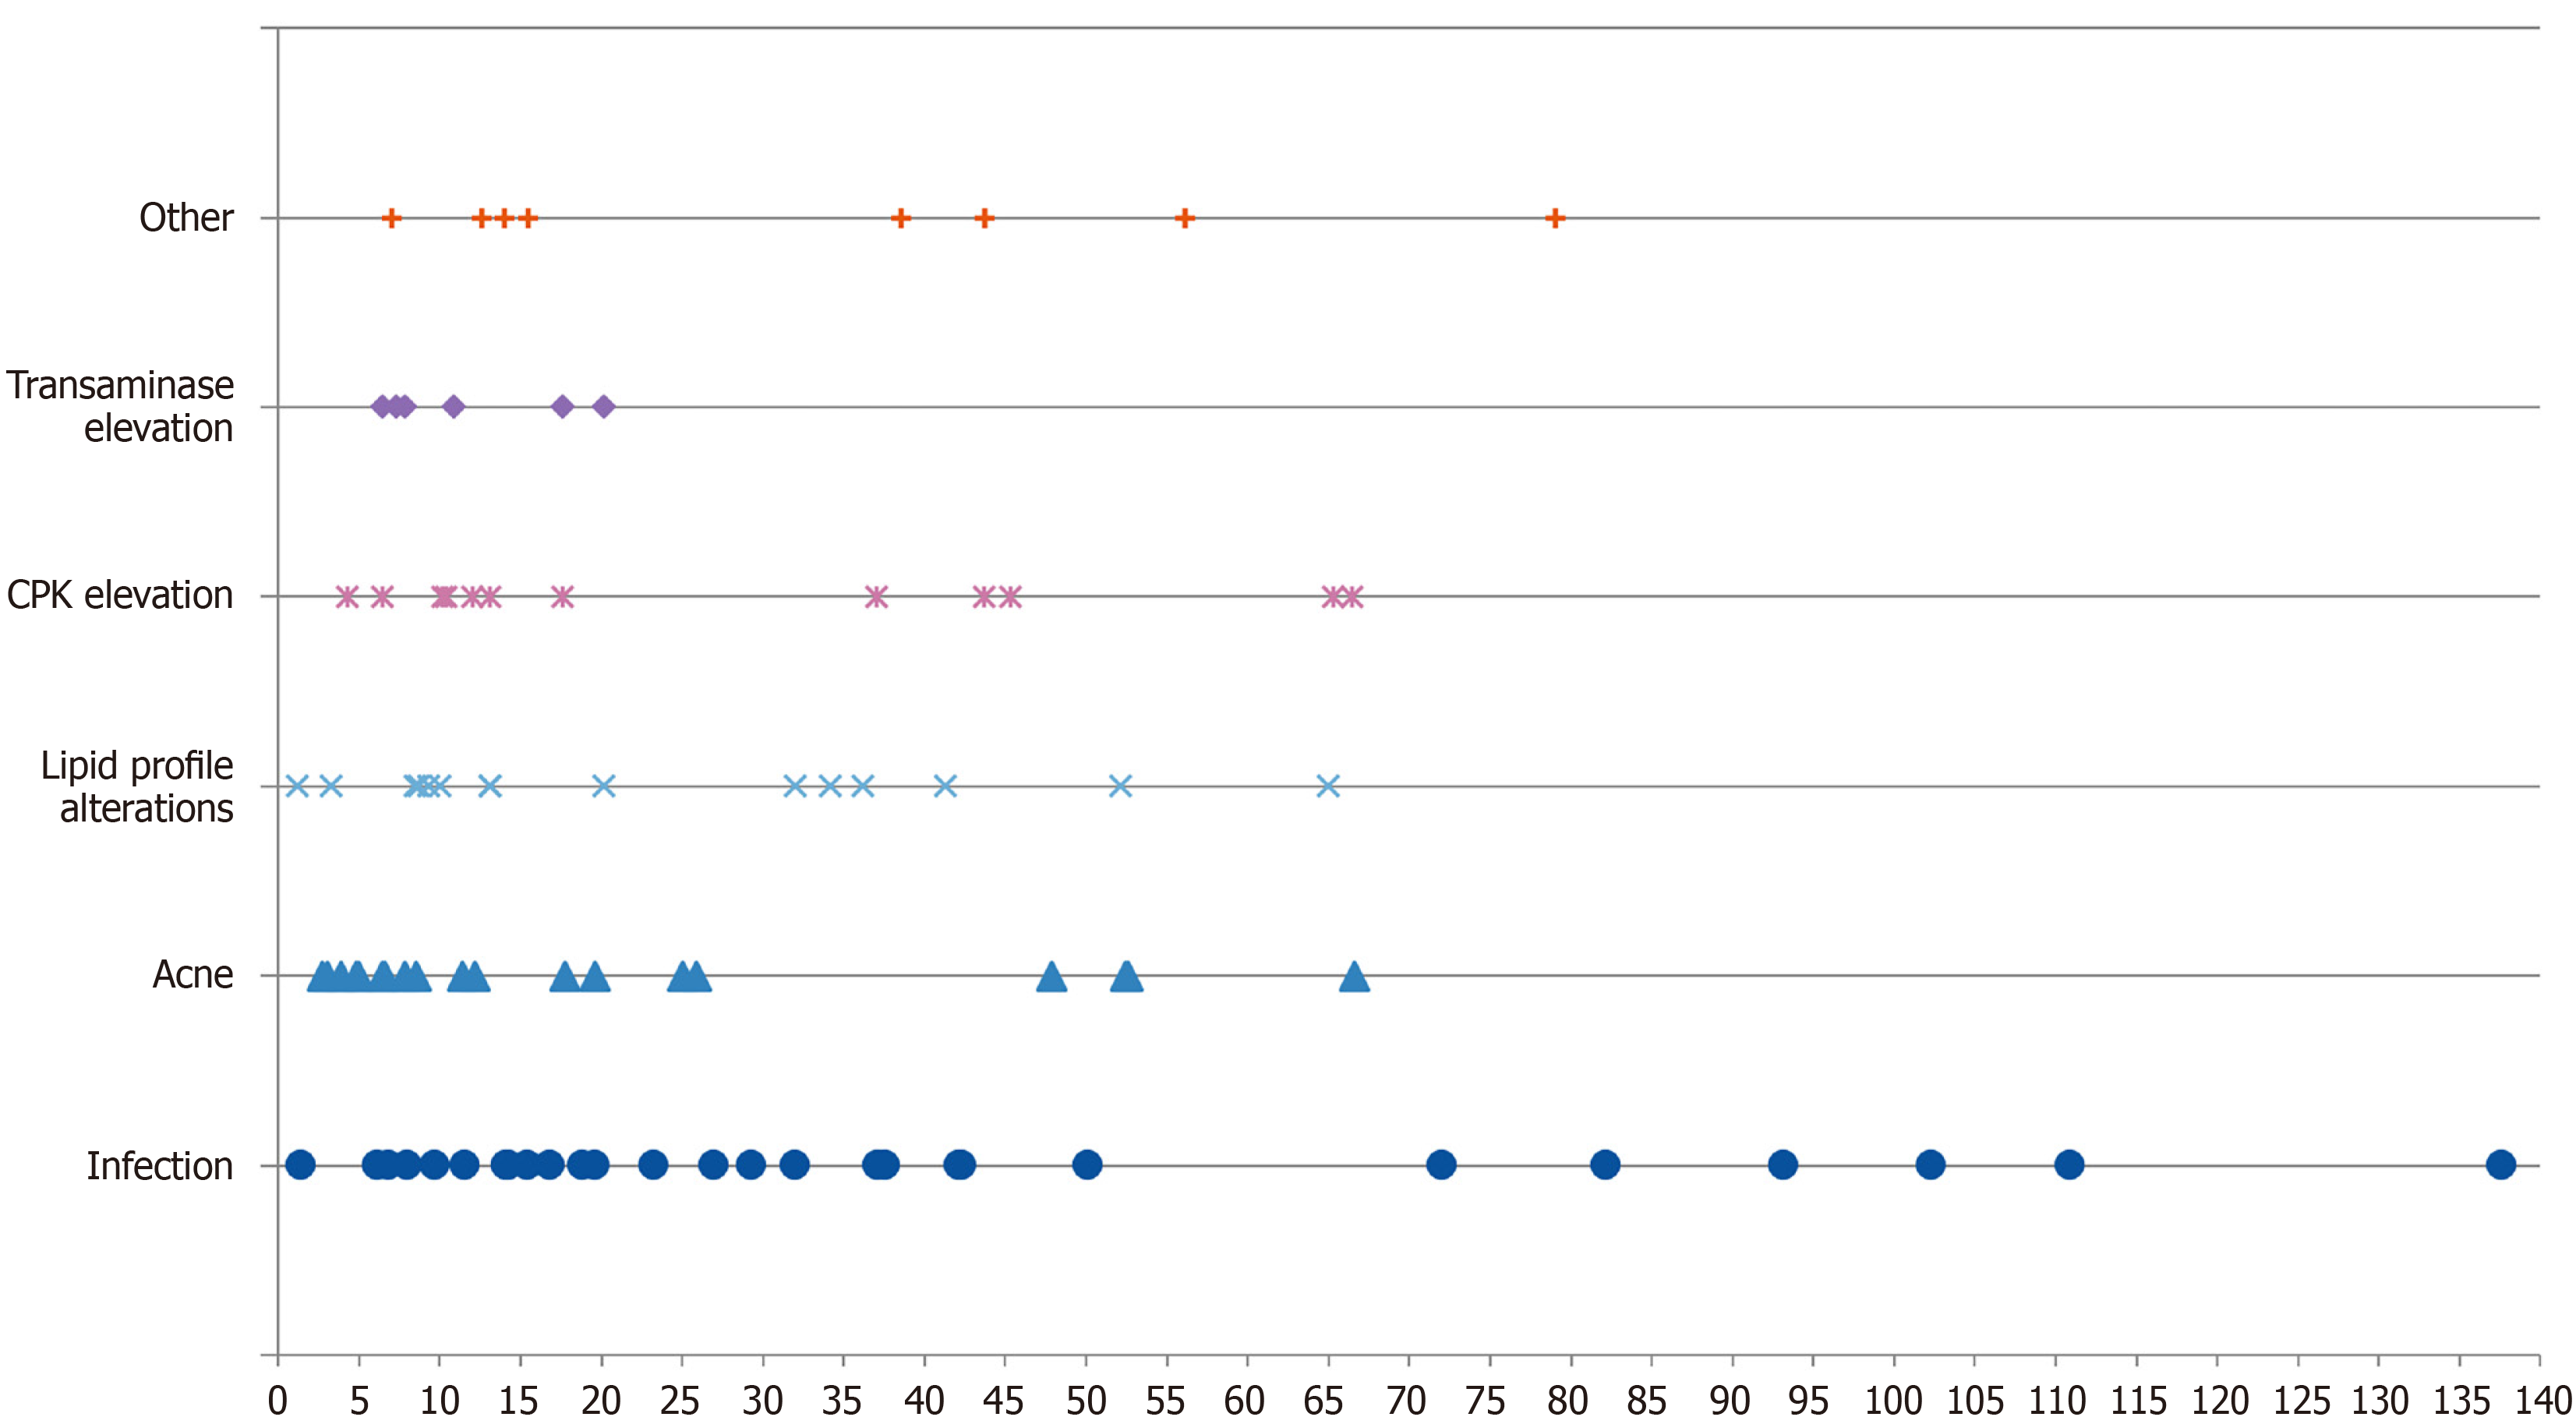
Figure 3 Time distribution of adverse events during treatment with upadacitinib.
The horizontal axis represents time in weeks after upadacitinib initiation. The vertical axis categorizes the recorded adverse events (AEs). Each data point denotes an individual event in each AE category, illustrating the onset and frequency of specific side effects recorded throughout the follow-up period. Symbols represent different AE categories. Blue circles: Infections; Blue triangles: Acne; Blue cross marks: Lipid profile alterations; Pink asterisks: Creatine phosphokinase levels elevation; Purple diamonds: Transaminase elevation; Orange plus signs: Other AEs. Other AEs: Hidradenitis suppurativa flare (one patient at week 7); erythema multiforme (one patient at week 13); hair loss - two patients at weeks 14 and 15); skin rash (one patient at week 39); elevated creatinine (one patient at week 44); migraine (one patient at week 56); leukopenia (one patient at week 79).
- Citation: Kitsou V, Kokkotis G, Avatziadis P, Ioannou A, Michopoulos S, Zampeli E, Bamias G. Real-world clinical outcomes, prognostic factors, and safety profile of upadacitinib in patients with inflammatory bowel disease. World J Gastrointest Endosc 2026; 18(10): 125564
- URL: https://www.wjgnet.com/1948-5190/full/v18/i10/125564.htm
- DOI: https://dx.doi.org/10.4253/wjge.125564