
















Copyright: ©Author(s) 2026.
World J Gastrointest Endosc. Oct 16, 2026; 18(10): 125564
Published online Oct 16, 2026. doi: 10.4253/wjge.125564
Published online Oct 16, 2026. doi: 10.4253/wjge.125564
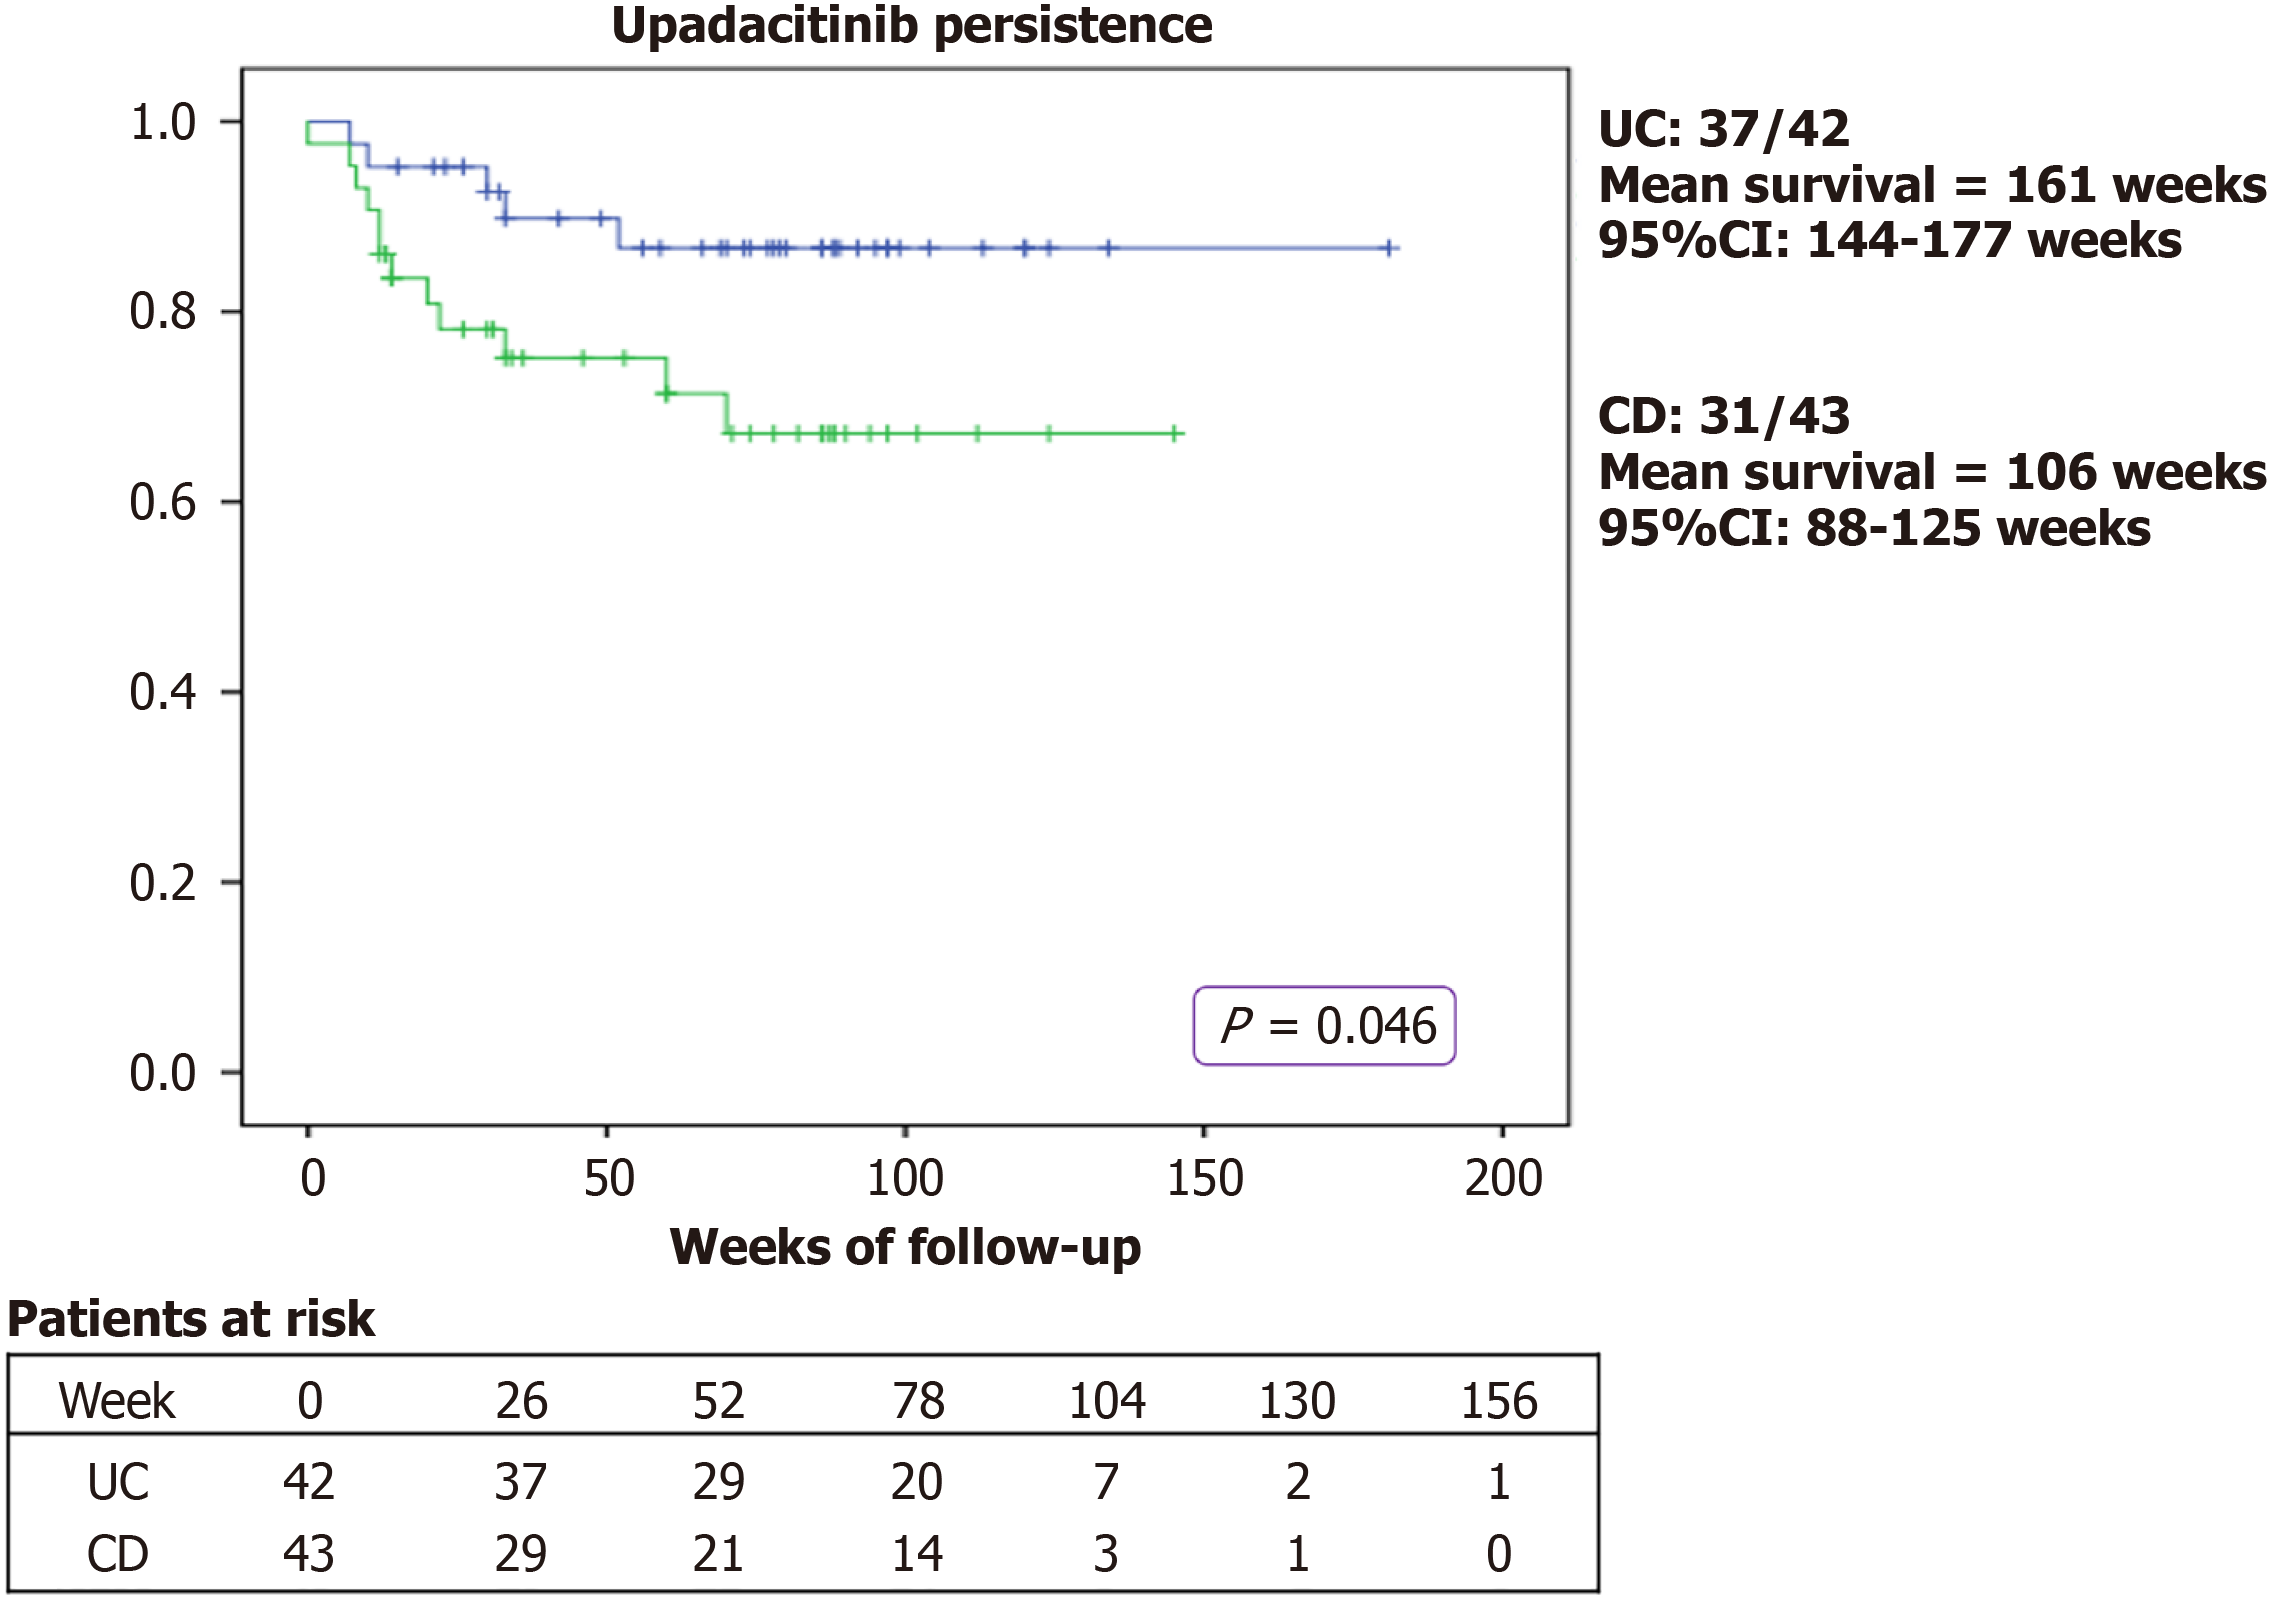
Figure 1 Kaplan-Meier curve of upadacitinib persistence.
The blue line represents patients with ulcerative colitis, and the green line represents patients with Crohn’s disease. Patients with ulcerative colitis achieved significantly higher persistence rates compared to those with Crohn’s disease (P = 0.046). Numbers beside the curves indicate the proportion of persistent patients at the end of follow-up for each group. UC: Ulcerative colitis; CD: Crohn’s disease; CI: Confidence interval.
- Citation: Kitsou V, Kokkotis G, Avatziadis P, Ioannou A, Michopoulos S, Zampeli E, Bamias G. Real-world clinical outcomes, prognostic factors, and safety profile of upadacitinib in patients with inflammatory bowel disease. World J Gastrointest Endosc 2026; 18(10): 125564
- URL: https://www.wjgnet.com/1948-5190/full/v18/i10/125564.htm
- DOI: https://dx.doi.org/10.4253/wjge.125564