Copyright
©The Author(s) 2019.
World J Gastrointest Endosc. Apr 16, 2019; 11(4): 271-280
Published online Apr 16, 2019. doi: 10.4253/wjge.v11.i4.271
Published online Apr 16, 2019. doi: 10.4253/wjge.v11.i4.271
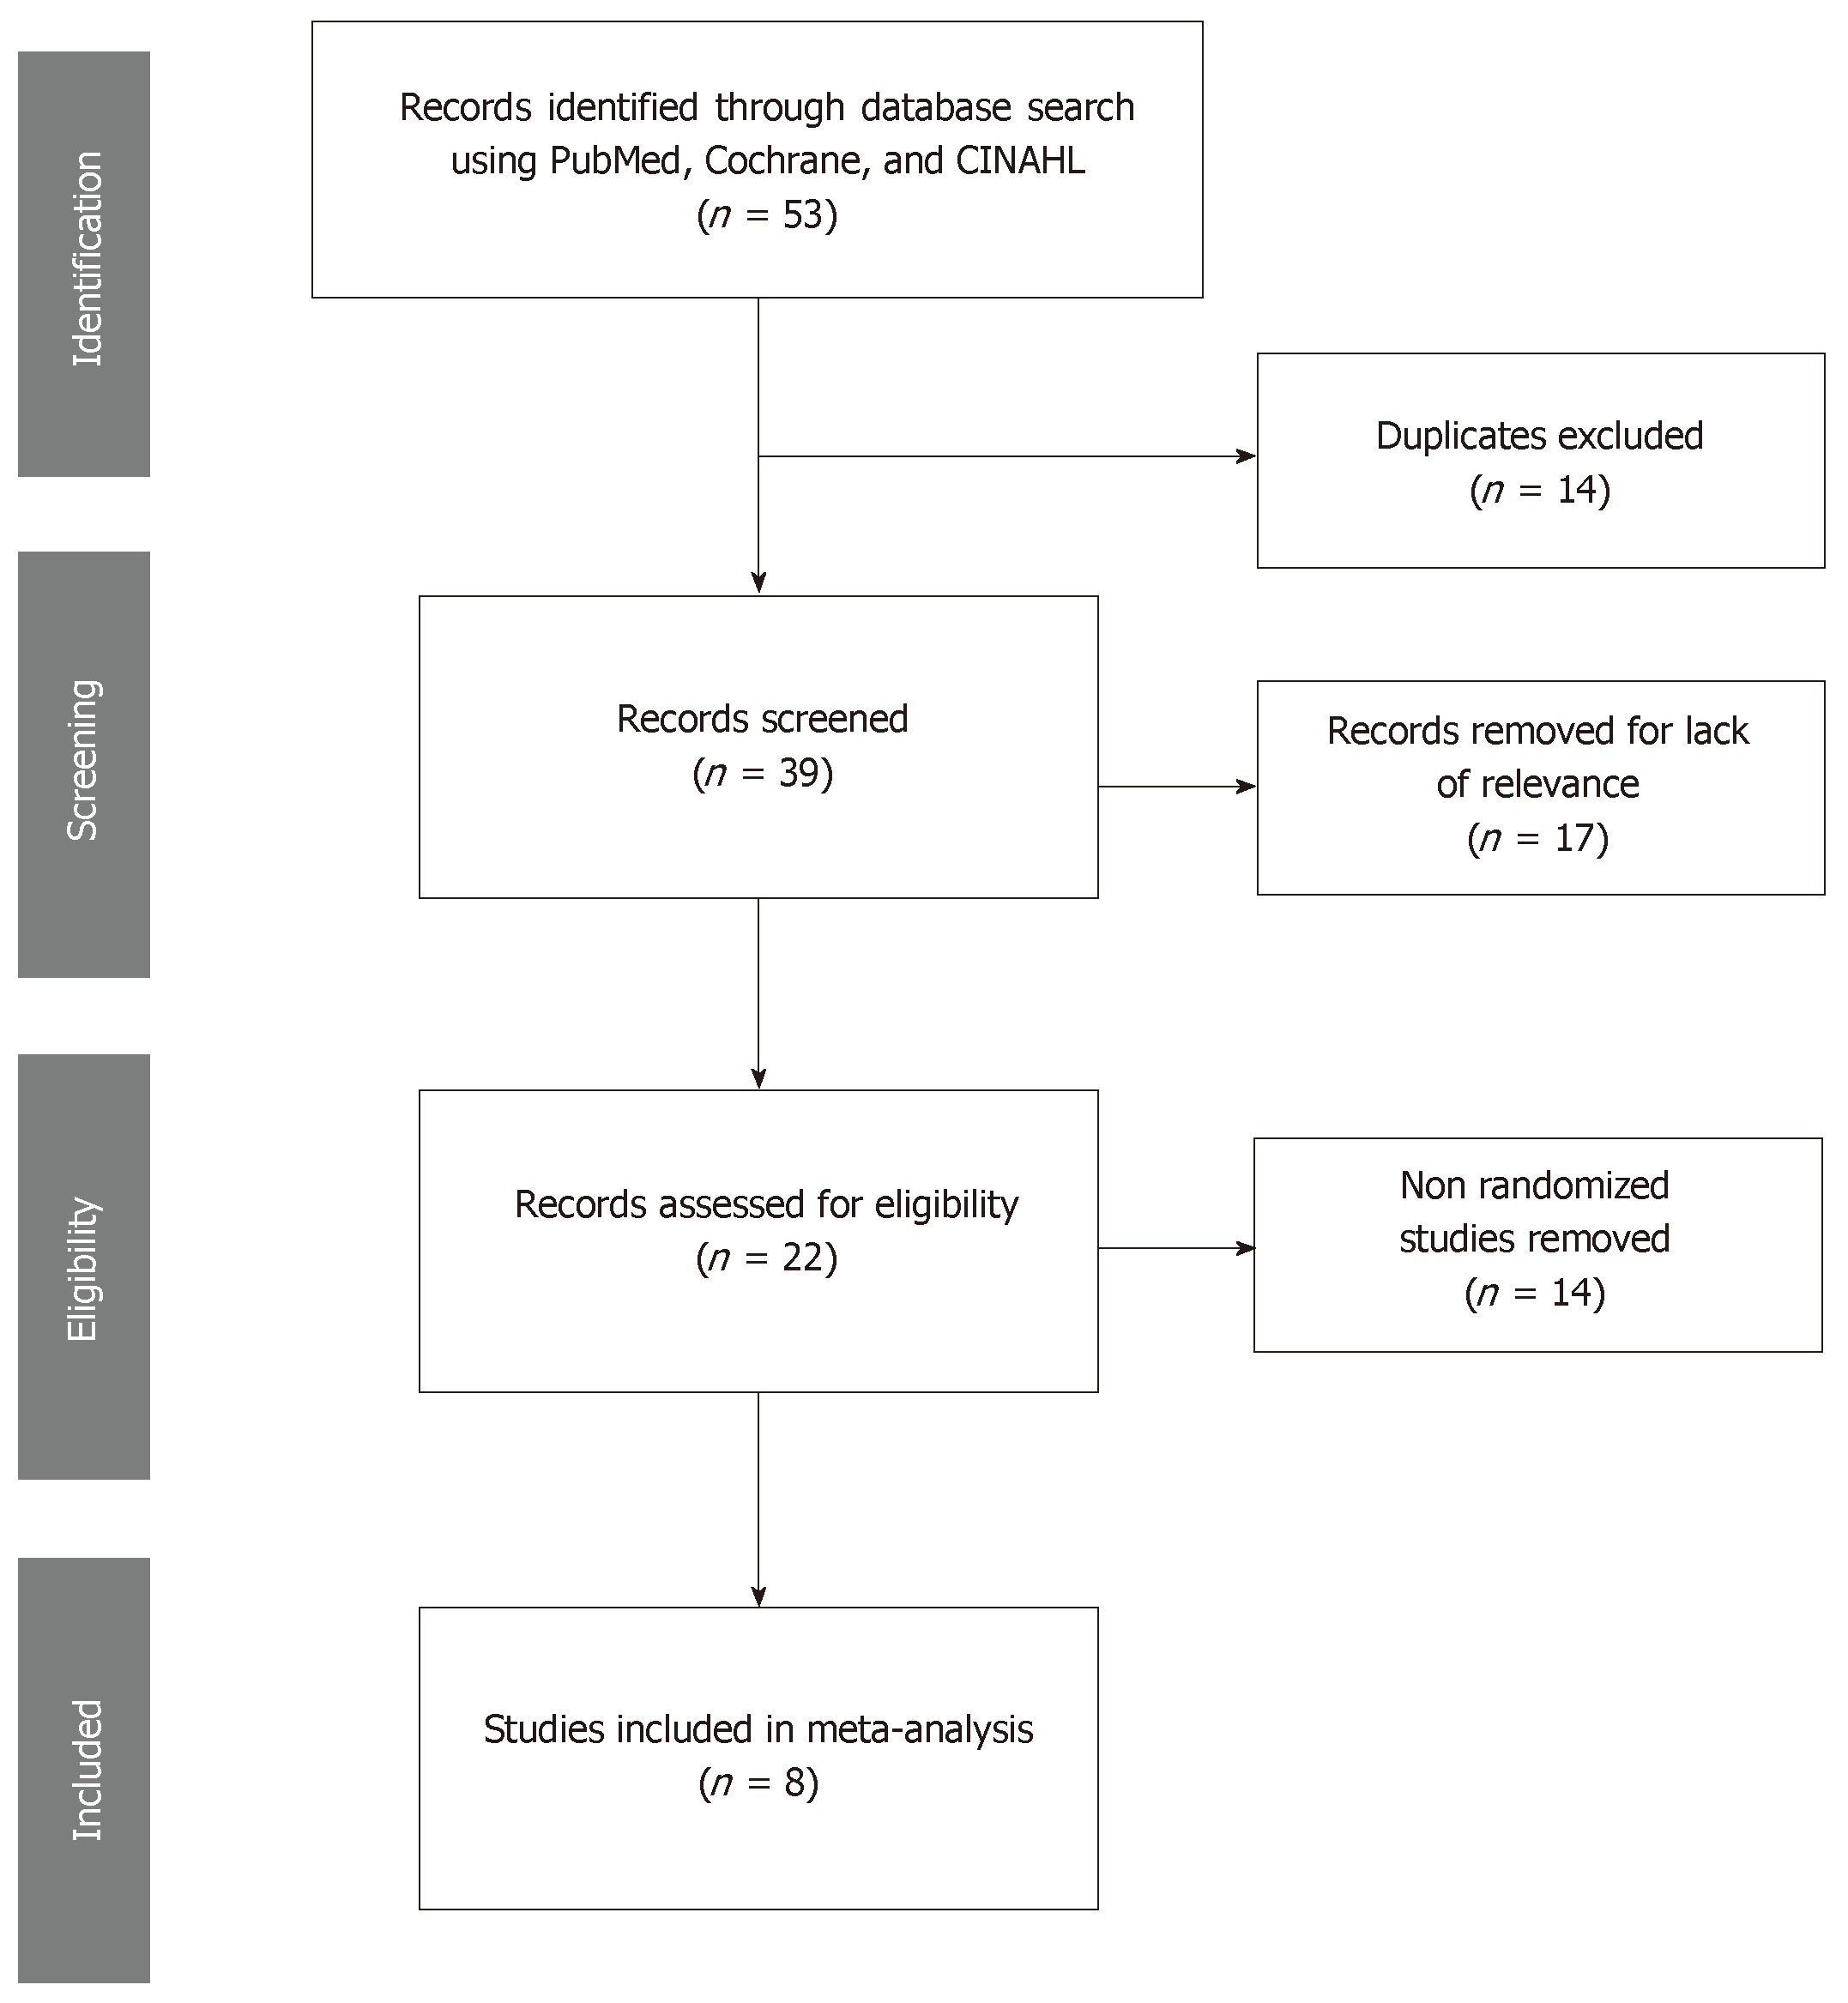
Figure 1 Flow chart of articles selected for this meta-analysis study.
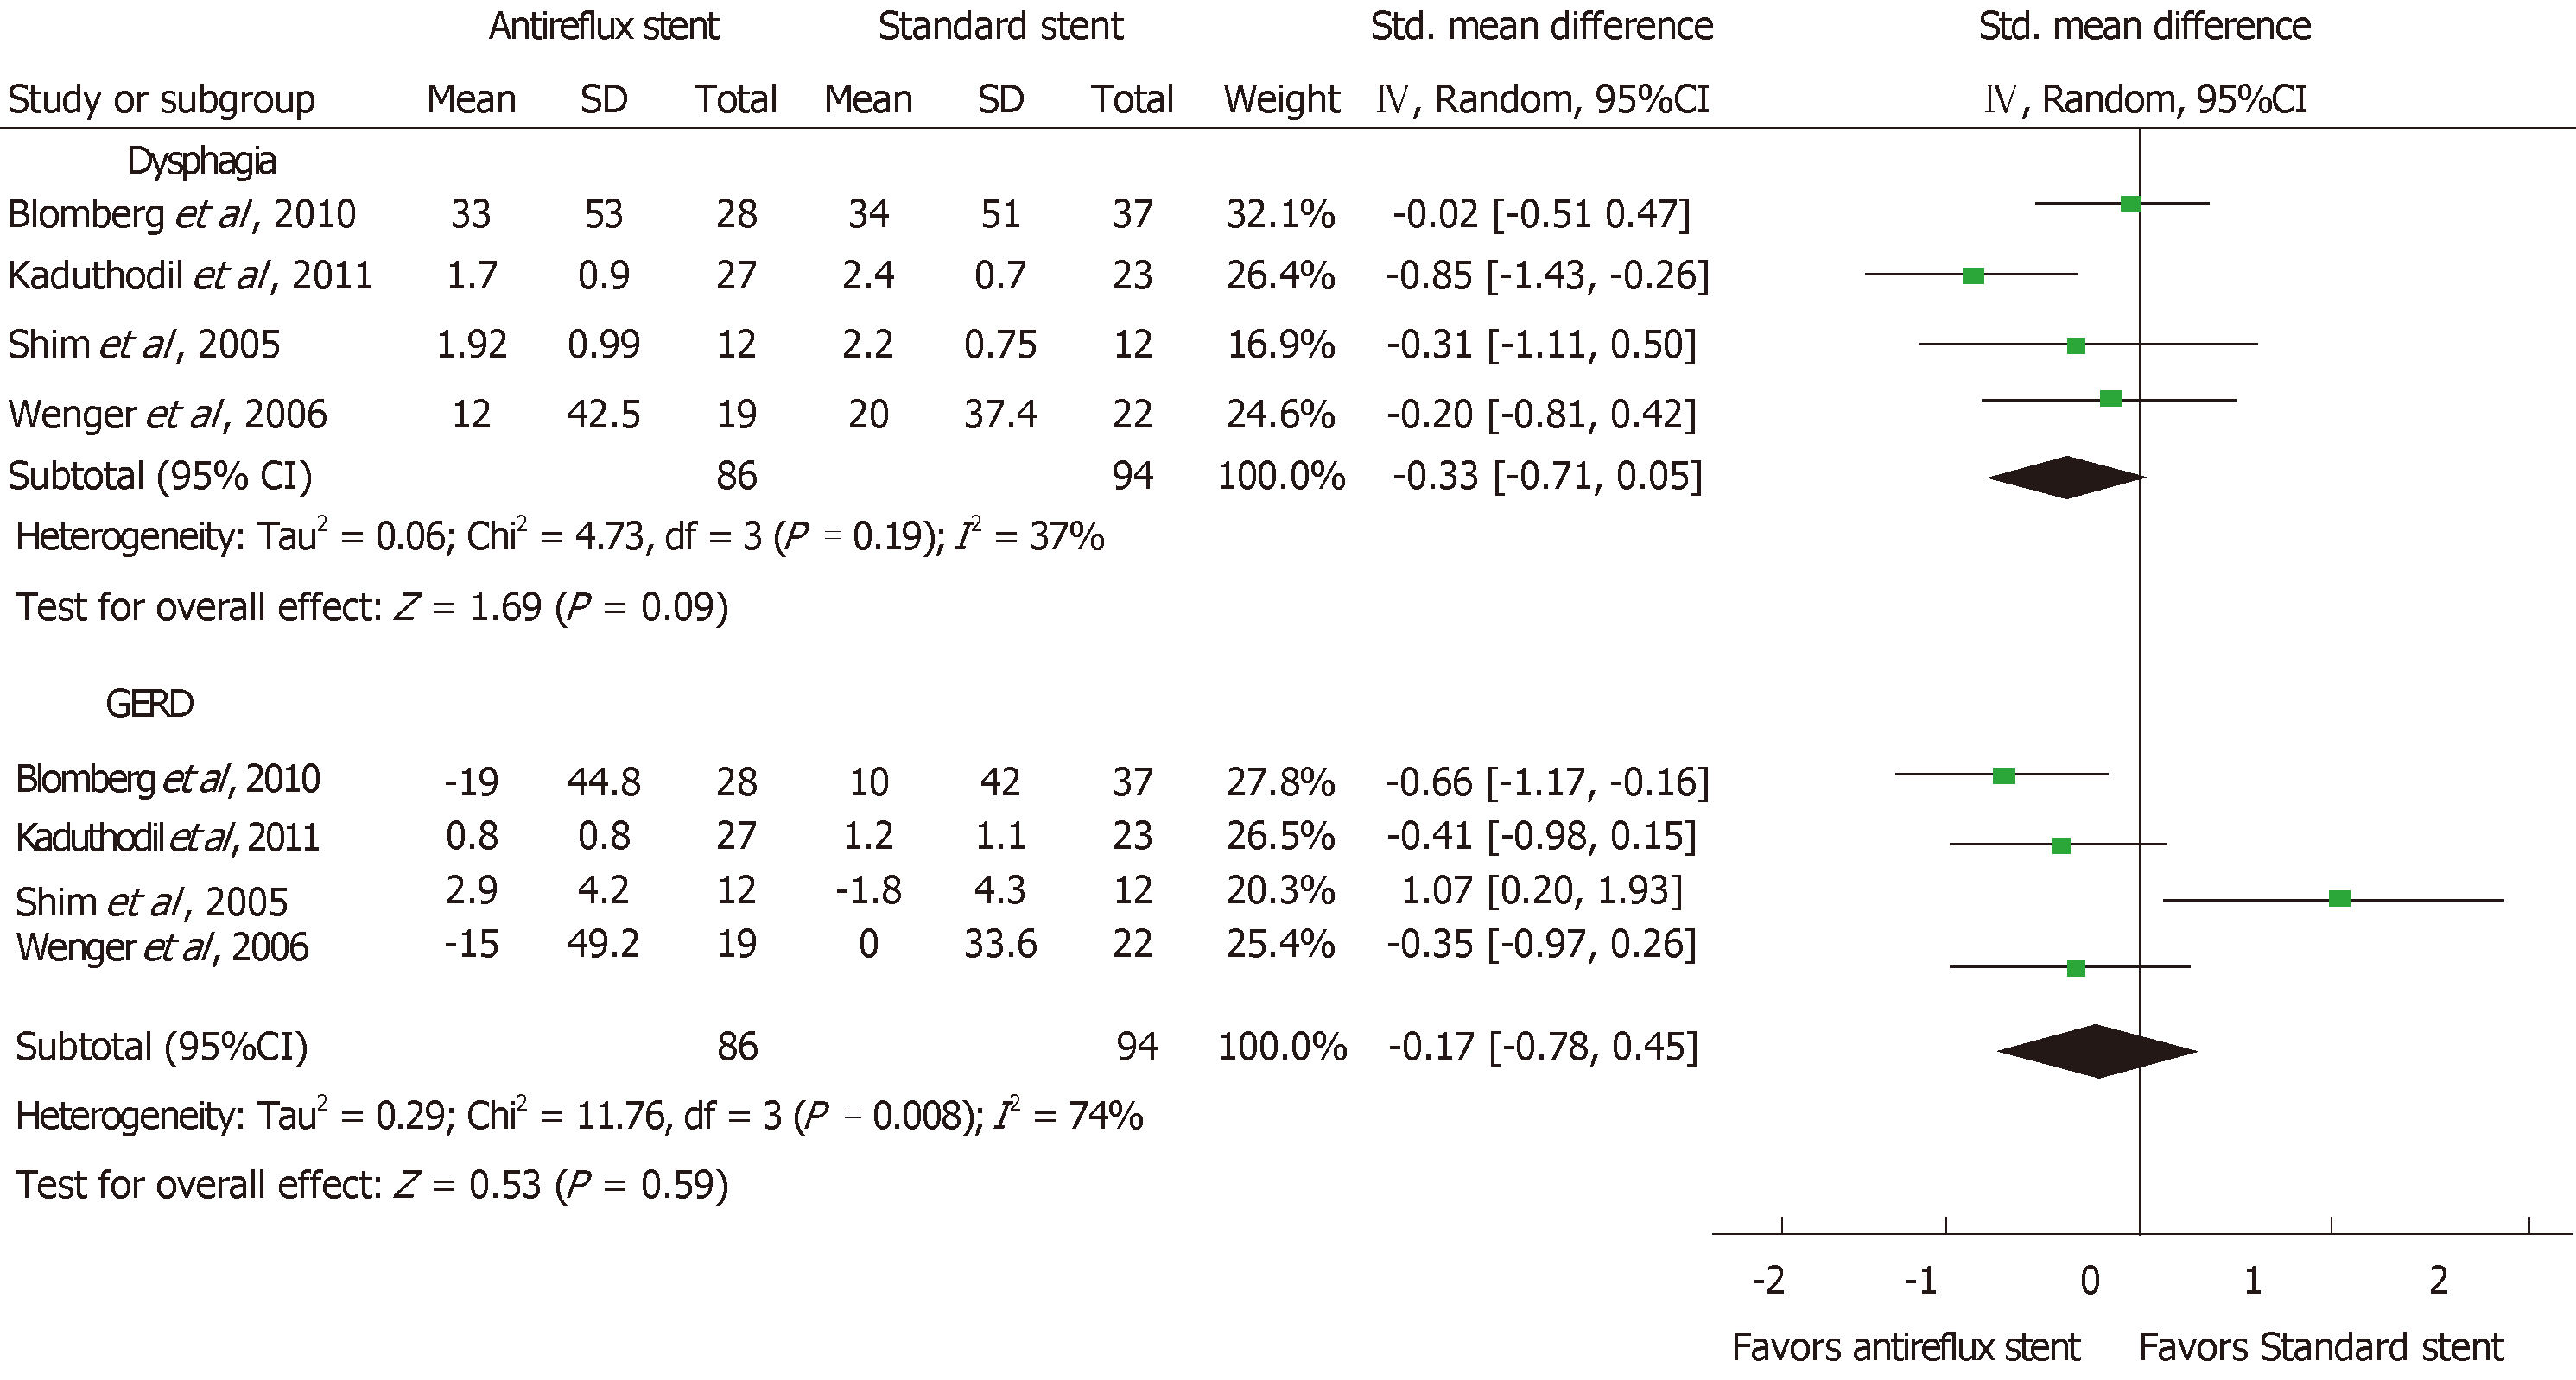
Figure 2 Forest plot comparing standardized mean difference in dysphagia and gastroesophageal reflux disease between anti-reflux stent and standard stent.
GERD: Gastroesophageal reflux disease.
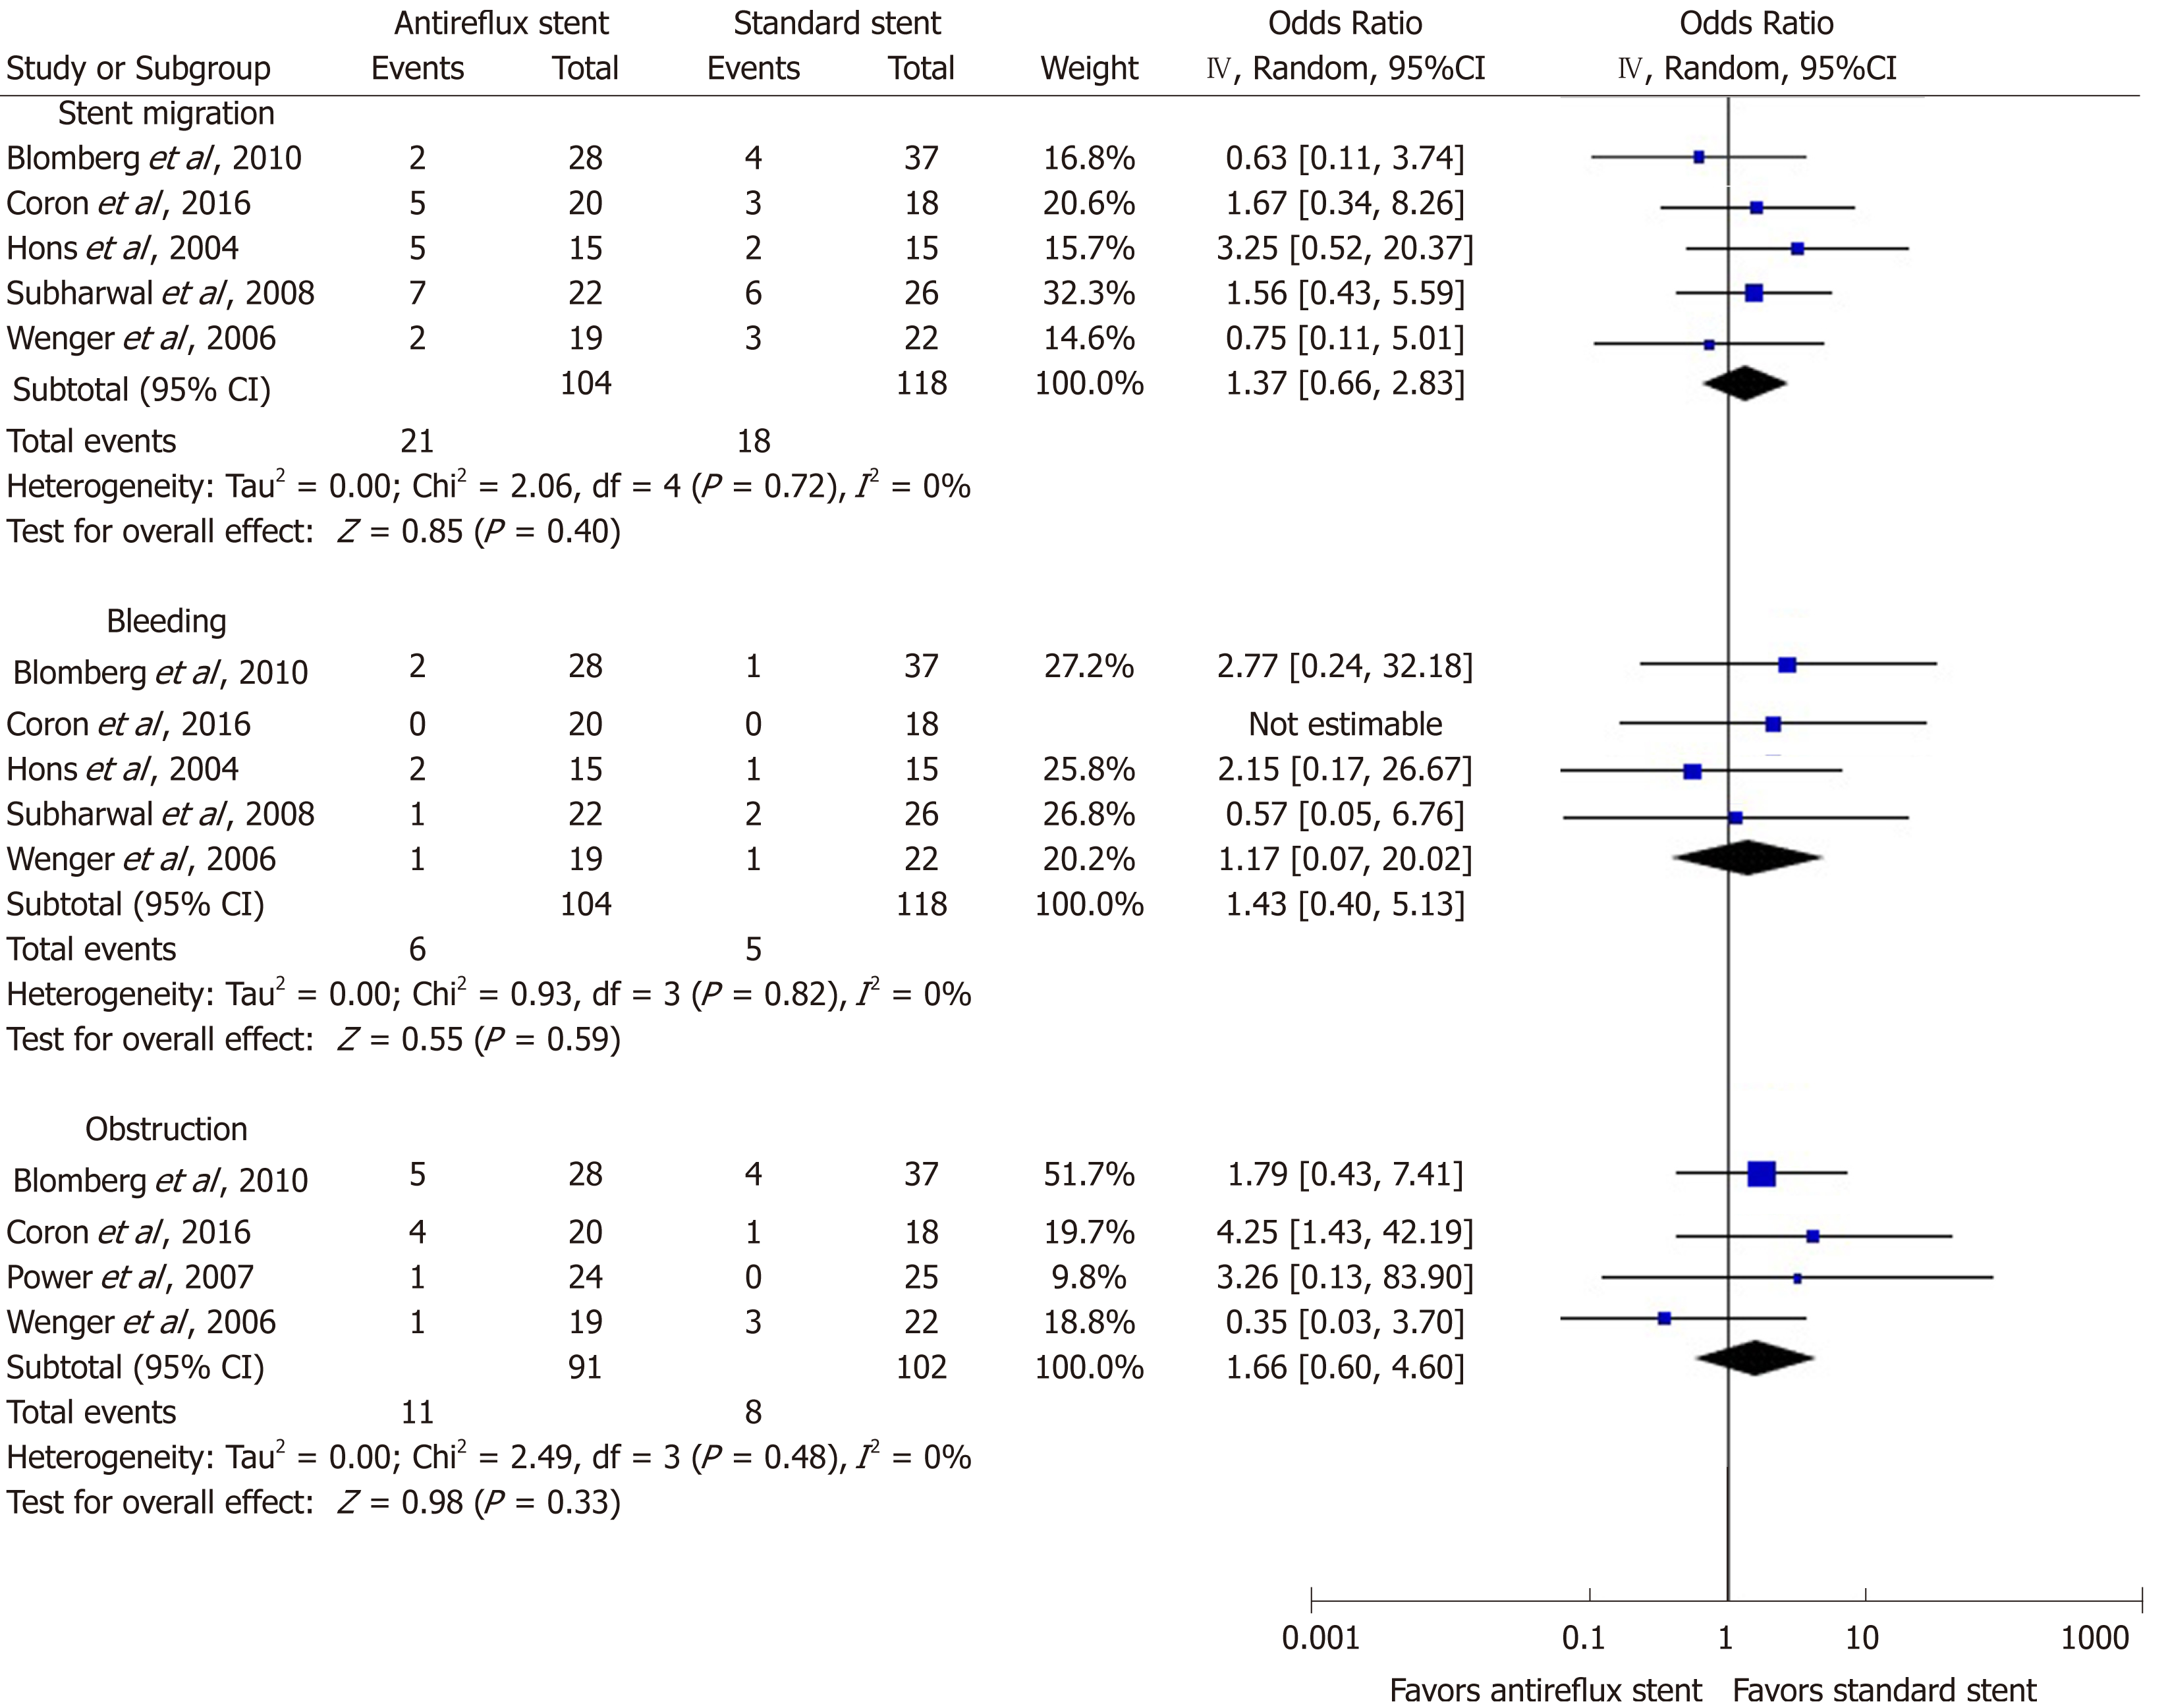
Figure 3 Forest plot comparing complications of stent migration, bleeding and obstruction between anti-reflux and standard stent.
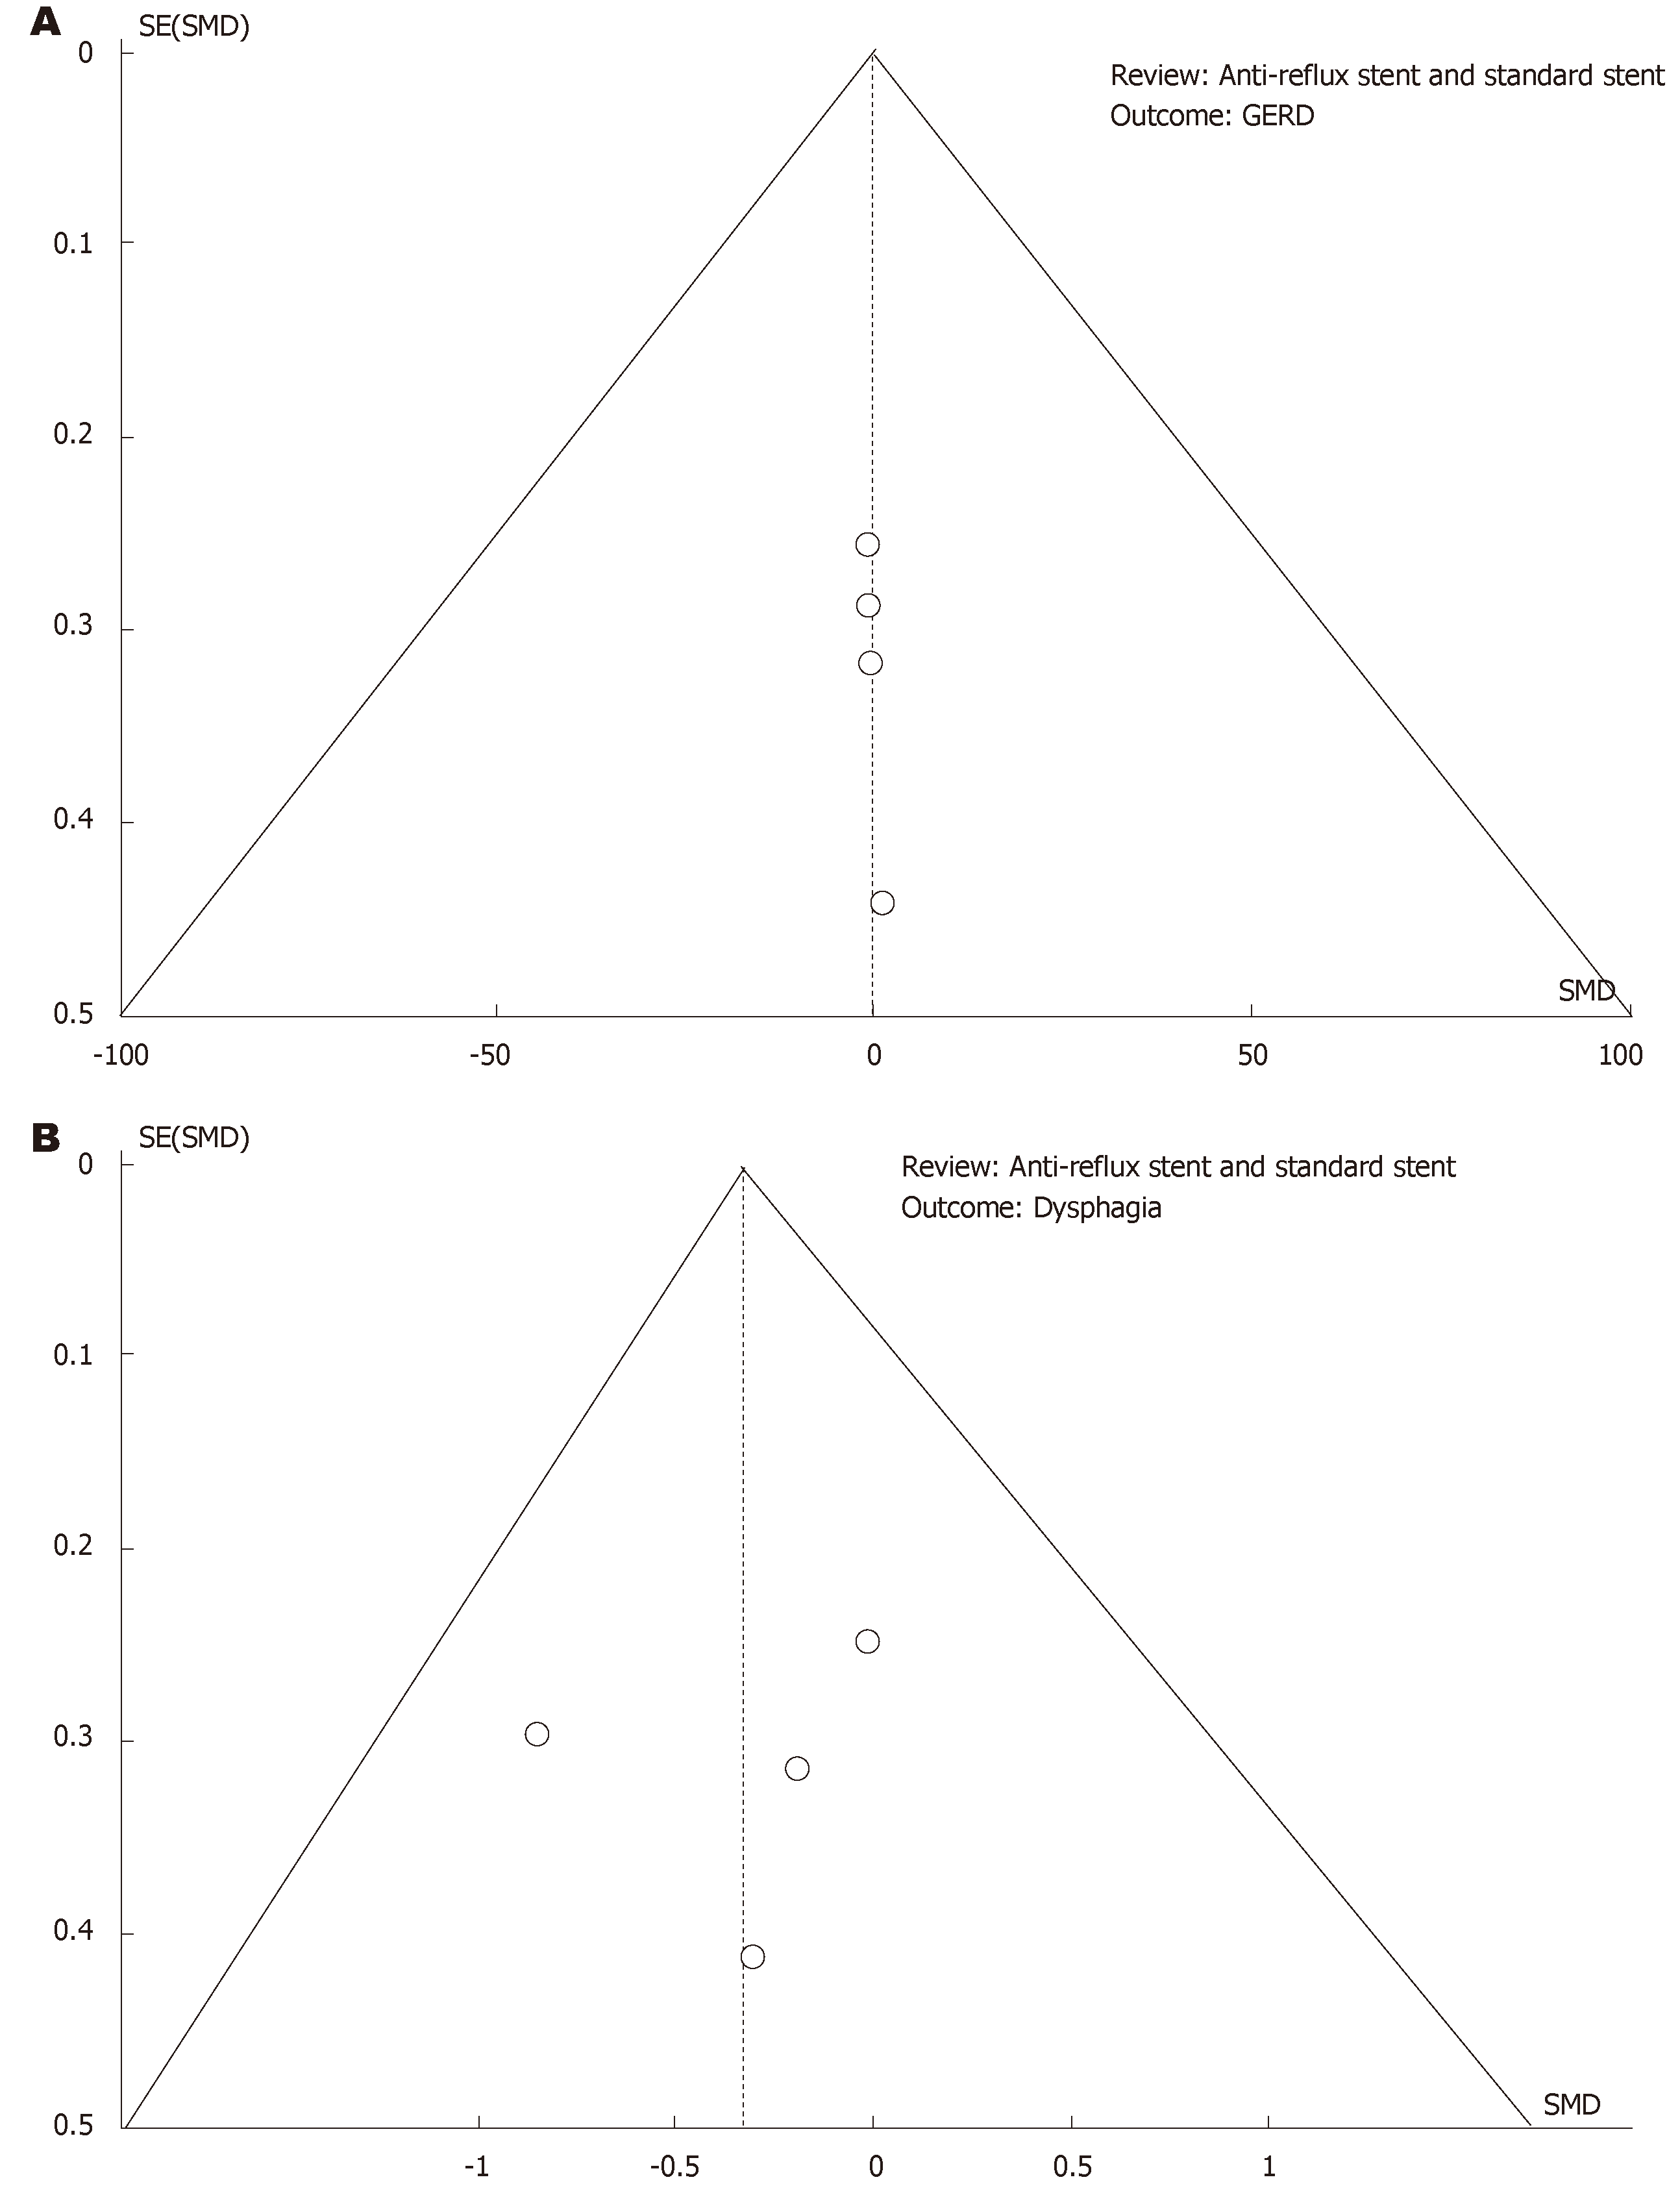
Figure 4 Funnel plot for publication bias.
A: Outcome gastroesophageal reflux disease; B: Outcome dysphagia. SMD: Standard mean difference; GERD: Gastroesophageal reflux disease.
- Citation: Pandit S, Samant H, Morris J, Alexander SJ. Efficacy and safety of standard and anti-reflux self-expanding metal stent: A systematic review and meta-analysis of randomized controlled trials. World J Gastrointest Endosc 2019; 11(4): 271-280
- URL: https://www.wjgnet.com/1948-5190/full/v11/i4/271.htm
- DOI: https://dx.doi.org/10.4253/wjge.v11.i4.271


