Copyright
©The Author(s) 2021.
World J Clin Cases. Dec 6, 2021; 9(34): 10451-10463
Published online Dec 6, 2021. doi: 10.12998/wjcc.v9.i34.10451
Published online Dec 6, 2021. doi: 10.12998/wjcc.v9.i34.10451
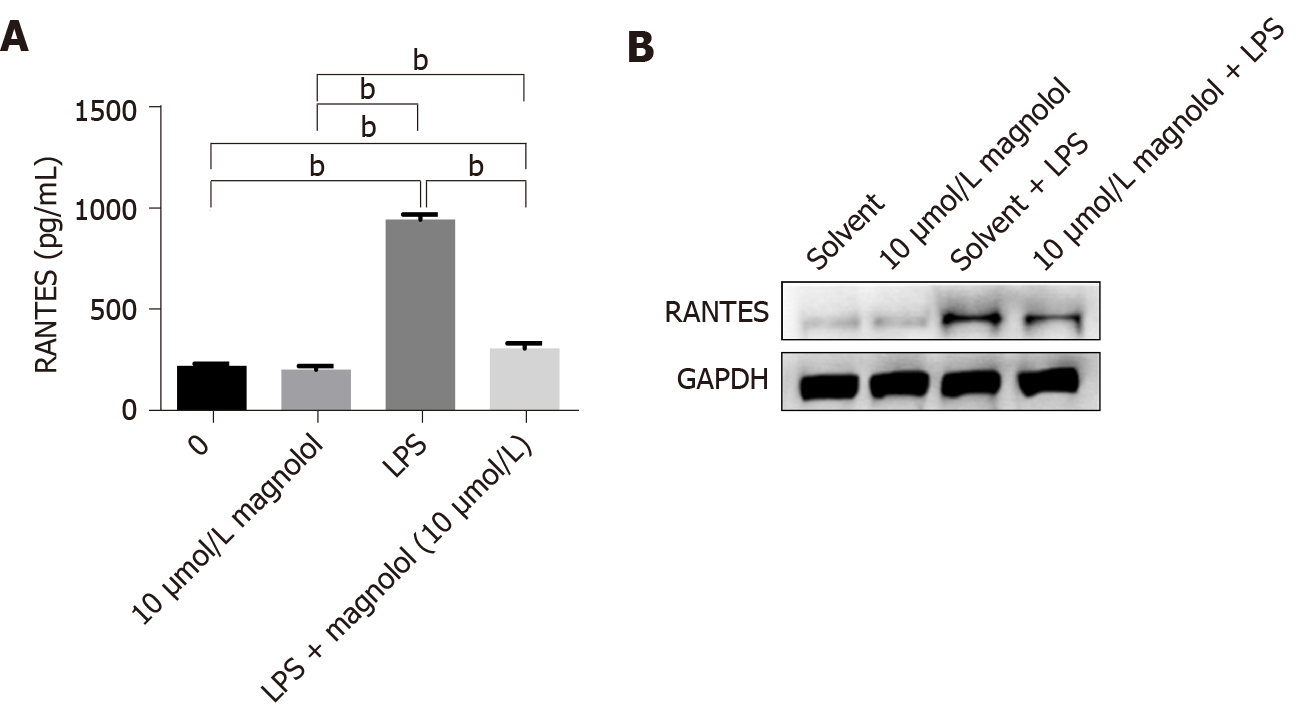
Figure 3 Expression of regulated on activation, normal T-cell expressed and secreted protein in Caco2 cells in each group.
A: The cells were pretreated with magnolol or solvent for 8 h, followed by lipopolysaccharide (LPS) (100 μg/mL) for 24 h. The content of RANTES in the supernatant of the four groups of cells was determined by ELISA. Data are presented as the mean ± SD; the comparison between different groups was performed using the LSD method in one-way ANOVA (bP < 0.01); B: The cells were pretreated with magnolol or solvent for 8 h and then with LPS (100 μg/mL) for 24 h. The expression of RANTES protein in Caco2 cells in each group was detected by Western blot analysis. 0 or Solvent: Treated with solvent only; 10 μmol/L magnolol: Treated with 10 μmol/L magnolol; LPS: Treated with solvent and LPS (100 μg/mL); LPS + magnolol 10 μmol/L: Treated with magnolol 10 μmol/L and with LPS (100 μg/mL); GAPDH: Glyceraldehyde-3-phosphate dehydrogenase; RANTES: Regulated on activation, normal T-cell expressed and secreted.
- Citation: Mao SH, Feng DD, Wang X, Zhi YH, Lei S, Xing X, Jiang RL, Wu JN. Magnolol protects against acute gastrointestinal injury in sepsis by down-regulating regulated on activation, normal T-cell expressed and secreted. World J Clin Cases 2021; 9(34): 10451-10463
- URL: https://www.wjgnet.com/2307-8960/full/v9/i34/10451.htm
- DOI: https://dx.doi.org/10.12998/wjcc.v9.i34.10451


