Copyright
©2011 Baishideng Publishing Group Co.
World J Methodol. Sep 26, 2011; 1(1): 22-26
Published online Sep 26, 2011. doi: 10.5662/wjm.v1.i1.22
Published online Sep 26, 2011. doi: 10.5662/wjm.v1.i1.22
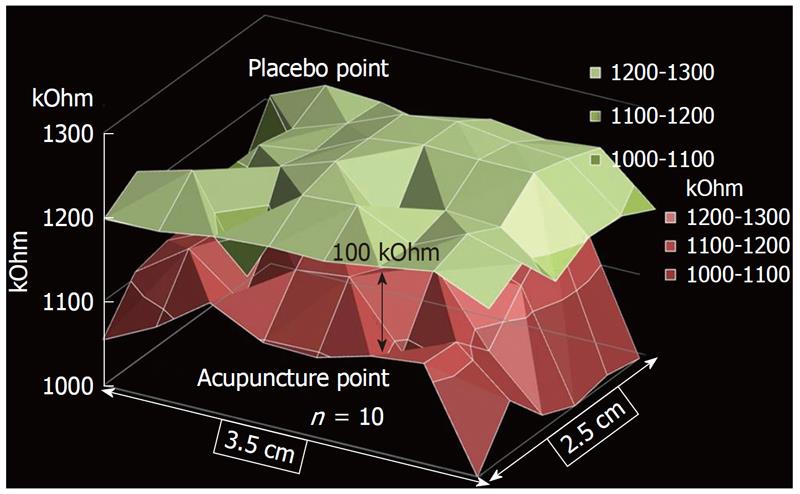
Figure 3 Graphical analysis of 48 channels of electrodermal skin impedance (average values of n = 10 persons) at an acupuncture point (below) and a non-acupuncture point (placebo point; above).
Note the mean difference between the two surrounding areas is about 100 kOhm. Modified from[16].
- Citation: Litscher G, Wang L, Gao XY, Gaischek I. Electrodermal mapping: A new technology. World J Methodol 2011; 1(1): 22-26
- URL: https://www.wjgnet.com/2222-0682/full/v1/i1/22.htm
- DOI: https://dx.doi.org/10.5662/wjm.v1.i1.22


