Copyright
©The Author(s) 2015.
World J Orthop. Apr 18, 2015; 6(3): 369-373
Published online Apr 18, 2015. doi: 10.5312/wjo.v6.i3.369
Published online Apr 18, 2015. doi: 10.5312/wjo.v6.i3.369
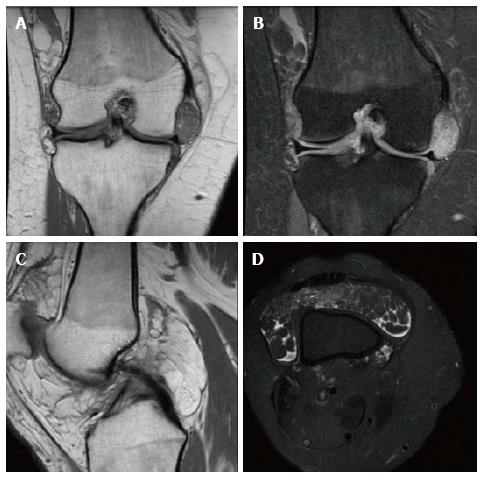
Figure 1 Right knee magnetic resonance imaging demonstrating effusion in the suprapatellar bursa and hypertrophic synovium with leaf-like projections of tissue which has the same signal intensity as fat.
A: Coronal proton density (PD); B: Coronal PD fat saturation; C: Sagittal PD; D: Axial T2 fat saturation.
- Citation: Miladore N, Childs MA, Sabesan VJ. Synovial lipomatosis: A rare cause of knee pain in an adolescent female. World J Orthop 2015; 6(3): 369-373
- URL: https://www.wjgnet.com/2218-5836/full/v6/i3/369.htm
- DOI: https://dx.doi.org/10.5312/wjo.v6.i3.369


