


Published online Jul 24, 2022. doi: 10.5306/wjco.v13.i7.616
Peer-review started: February 9, 2022
First decision: April 13, 2022
Revised: April 24, 2022
Accepted: June 3, 2022
Article in press: June 3, 2022
Published online: July 24, 2022
The development of precision medicine is essential for personalized treatment and improved clinical outcome, whereas biomarkers are critical for the success of precision therapies.
To investigate whether iCEMIGE (integration of CEll-morphometrics, MIcro
We used our recently developed machine learning technique to identify cellular morphometric biomarkers (CMBs) from the whole histological slide images in The Cancer Genome Atlas (TCGA) breast cancer (TCGA-BRCA) cohort. Multivariate Cox regression was used to assess whether cell-morphometrics prognosis score (CMPS) and our previously reported 12-gene expression prognosis score (GEPS) and 15-microbe abundance prognosis score (MAPS) were independent prognostic factors. iCEMIGE was built upon the sparse representation learning technique. The iCEMIGE scoring model performance was measured by the area under the receiver operating characteristic curve compared to CMPS, GEPS, or MAPS alone. Nomogram models were created to predict overall survival (OS) and progress-free survival (PFS) rates at 5- and 10-year in the TCGA-BRCA cohort.
We identified 39 CMBs that were used to create a CMPS system in BCs. CMPS, GEPS, and MAPS were found to be significantly independently associated with OS. We then established an iCEMIGE scoring system for risk stratification of BC patients. The iGEMIGE score has a significant prognostic value for OS and PFS independent of clinical factors (age, stage, and estrogen and progesterone receptor status) and PAM50-based molecular subtype. Importantly, the iCEMIGE score significantly increased the power to predict OS and PFS compared to CMPS, GEPS, or MAPS alone.
Our study demonstrates a novel and generic artificial intelligence framework for multimodal data integration toward improving prognosis risk stratification of BC patients, which can be extended to other types of cancer.
Core Tip: Cancer heterogeneity consistently results in a large variation in the prognosis of patients after a certain treatment. The discovery of biomarkers for predicting prognosis can significantly assist clinical oncologists in making treatment decisions for cancer patients. Our results revealed that iCEMIGE (integration of cell-morphometrics, microbiome, and gene biomarker signatures) significantly improves risk stratification of BC patients. The clinical utility of iCEMIGE needs to be further validated in retrospective and prospective cohort studies to determine whether the iCEMIGE score can provide sufficient predictive information to stratify patients by risk and guide treatment. If so, the iCEMIGE score could assist clinicians in decision-making about cancer treatment and enable more personalized cancer therapy.
- Citation: Mao XY, Perez-Losada J, Abad M, Rodríguez-González M, Rodríguez CA, Mao JH, Chang H. iCEMIGE: Integration of CEll-morphometrics, MIcrobiome, and GEne biomarker signatures for risk stratification in breast cancers. World J Clin Oncol 2022; 13(7): 616-629
- URL: https://www.wjgnet.com/2218-4333/full/v13/i7/616.htm
- DOI: https://dx.doi.org/10.5306/wjco.v13.i7.616
Cancer is a complex and heterogeneous disease that displays many morphological, genetic, and epigenetic features[1]. Cancer heterogeneity consistently results in a large variation in clinical outcomes of patients after a certain treatment[2], and therefore the development of precision medicine is essential for personalized treatment and improved clinical outcome[3-6]. The discovery of biomarkers for predicting prognosis, a critical step toward precision medicine, can significantly assist clinical onco
Microscopic examination of the histology, which encompasses the morphological features of cancer cells, is the oldest and most basic way of cancer classification. A complete and accurate pathological cancer classification is still crucial to deciding on the best treatment plan for patients. Recently, we developed a framework powered by artificial intelligence (AI) technique for identifying cellular morphometric biomarkers (CMBs) and cellular morphometric subtypes (CMSs) from the whole slide images (WSI) of Hematoxylin and Eosin (H&E)-stained tissue histology[10,11]. We demonstrated that CMSs were significantly associated with specific molecular alterations, immune microenvironment, and prognosis in lower-grade gliomas[10].
With the rapid biotechnological development, such as next-generation sequencing, different aspects of genomic heterogeneity have been uncovered in cancers[12], which dramatically speed the discovery of molecular biomarkers for precision diagnosis and therapy. For example, several molecular biomarkers have been developed for clinical practice in breast cancer (BC)[13,14], including PAM50 (Prosigna, South San Francisco, United States), OncotypeDx (Exact Sciences Corp., Madison, United States), and MammaPrint (Agendia, Amsterdam, Netherlands).
In addition to cancer genomic heterogeneity, a significant number of studies have revealed the diversity of the microbiome in cancer and the roles of the microbiome in cancer development and response to therapies[15-18]. We have recently developed a novel cancer microbiome signature for predicting the prognosis of BC patients[19]. Given the importance of tissue histology, genomics, and microbiome in cancer diagnosis and treatment, efficient and effective integration of these multimodal data is believed to open a new era for precision oncology[20].
In this study, we developed a strategy to integrate multimodal data (Figure 1) and investigated whether iCEMIGE (integration of cell-morphometrics, microbiome, and gene biomarker signatures) improves the risk stratification of BC patients. We first used our recently developed machine learning technique (CMS-ML) to identify the CMBs from the WSIs in The Cancer Genome Atlas (TCGA) breast cancer (TCGA-BRCA) cohort and established a cellular-morphometrics prognosis score (CMPS). We then demonstrated that CMPS, together with our previously reported 12-gene expression prognosis score (GEPS)[21] and the 15-microbe abundance prognosis score (MAPS)[19] were independent prognostic factors. Finally, we established the iCEMIGE scoring system and assessed its clinical value and prognosis predictive power compared to GEPS, MAPS, and CMPS alone.

The TCGA-BRCA cohort was used in this study. The patient diagnostic tissue histology slides were downloaded from GDCportal (https://portal.gdc.cancer.gov/). TCGA-BRCA microbiome, transcriptome, and clinical data, including PAM50-based molecular subtypes, were downloaded from the cBioPortal (https://www.cbioportal.org/)[22,23]. No additional modifications were made to the downloaded data during our analyses.
Following our previous work[10], we deployed an unsupervised feature learning pipeline, which was based on the stacked predictive sparse decomposition (SPSD)[24,25], for unsupervised discovery of underlying cellular morphometric characteristics from 15 cellular morphological features that were extracted from the diagnostic slides from the TCGA-BRCA cohort. 256 cellular morphometric biomarkers (CMB) were defined for cellular object representation. Specifically, we used a single network-layer with 256 dictionary elements (i.e., CMBs) and a sparsity constraint of 30 at a fixed random sampling rate of 1000 cellular objects per WSIs from the TCGA-BRCA cohort. The pre-trained SPSD model reconstructed each cellular region (represented as a vector of 15 morphometric properties) as a sparse combination of pre-defined 256 CMBs and thereafter represents each patient as an aggregation of all delineated cellular objects belonging to the same patient.
The prognostic effect of high or low levels of each CMB on overall survival (OS) was assessed by Kaplan-Meier analysis (survminer package in R, Version 0.4.8) and log-rank test (survival package in R, Version 3.2-3), where the TCGA-BRCA cohort was divided into two groups (i.e., CMB-high and CMB-low groups) based on each CMB (survminer package in R, Version 0.4.8). The set of CMBs as a prognostic signature were selected via a multivariate CoxPH regression model including these CMBs with a significant effect on OS.
Finally, we calculated the cellular morphometric prognosis score (CMPS) using the formula below, where the coefficients of the final CMBs as categorical variables were obtained from multivariate CoxPH regression analysis:
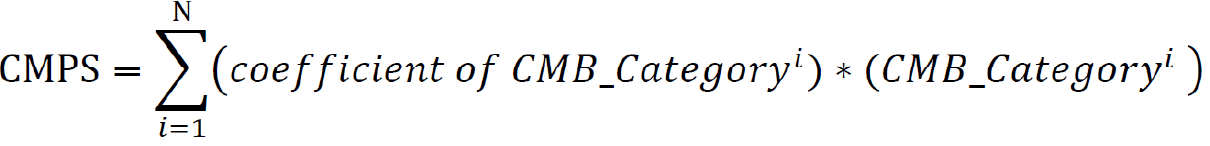
Where N is the number of final CMBs that were independently and significantly associated with OS, and CMB_Categoryiis the category of the ithCMB (i.e., CMB-high: 1; CMB-low: 0).
We extended the unsupervised feature learning pipeline (SPSD)[24,25] to achieve efficient and effective mining of multi-modal biomarker signatures from prebuilt cellular-morphometrics, microbiome, and gene biomarkers. Given X = [x1,…,xN] ∈ Rm×N as a set of patients (N) with a combination of biomarkers from different modalities (i.e., cellular-morphometrics, microbiome, and gene biomarkers), the formulation of the iCEMIGE multi-modal biomarker mining model was defined as follows.
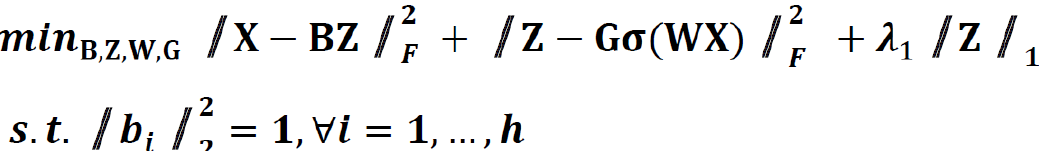
Where B = [b1,…,bh] ∈ Rm×h was a set of multi-modal biomarkers to be mined. Each multi-modal biomarker (b) was composed of m individual biomarker (e.g., m = 66 in our study); Z = [z1,…,zN] ∈ Rh×N was the sparse multi-modal biomarker expression matrix, where zi was the sparse multi-modal biomarker expression profile of the original patient biomarkers (xi), consisting of relative abundances of all (h) multi-modal biomarkers that contributed to the reconstruction of xi; W ∈ Rh×m was the auto-encoder for efficient and effective extraction of sparse multi-modal biomarker expression matrix (Z) from original patient biomarker data (X); G = diag (g1,..,gh) ∈ Rh×h was a scaling matrix with diag being an operator aligning vector [g1,..,gh], along the diagonal; σ(·) was an element-wise sigmoid function; λ1 was the regularization constant to ensure the sparsity of Z, such that only a subset of multi-modal biomarkers was utilized during the reconstruction of original patient biomarker data.
The first constraint: 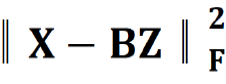 , penalized the reconstruction error of original patient biomarker data (X) with multi-modal biomarker (B) and the corresponding sparse multi-modal biomarker expression matrix (Z), which helped minimize the loss of individual biomarker information; the second constraint:
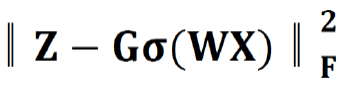 , penalized the approximation error of sparse multi-modal biomarker expression matrix (Z) with the auto-encoder, which helped improve the accuracy of multi-modal biomarker extraction for new patients; the third constraint:
 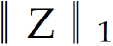 , penalized the sparsity of the multi-modal biomarker expression matrix, which helped ensure the utilization/activation of dominant multi-modal biomarkers during the learning process.
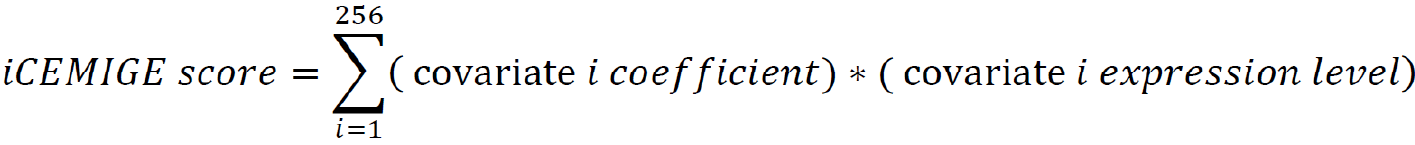
After multi-modal biomarker mining (i.e., 256 multi-modal biomarkers mined in this study), a multivariate Cox regression was performed on 256 multi-modal biomarker signatures, defined as 256 covariates using the TCGA-BRCA dataset. The iCEMIGE score of each patient was calculated by the following formula:
A nomogram model (rms package in R, Version 6.0-1) was constructed to predict 5- and 10-year OS probability of BC patients. The time-dependent receiver operating characteristic (ROC) curve (survival ROC package in R, Version 1.0.3) and concordance index (C-index) were used to evaluate the performance of the nomogram model, where the C-index was repeated with 1000 bootstrapping iterations and an 80% sampling rate per iteration. Mann-Whitney non-parametric test was used for the comparison across models.
The cohort of patients were divided into three groups (Poor: top third; Intermediate: middle third; and Good: bottom third) based on CMPS or iCEMIGE score. The independent prognostic impact of different scores (CMPS and iCEMIGE) was assessed by multivariate CoxPH regression including the clinical factors (age, stage, ER, and PR status) and PAM50-based molecular subtype. All statistical analyses were performed through either SPSS 24.0 (IBM, NY, United States) or R (version 4.0.2, https://www.r-project.org/). Graphic visualizations were generated by R (ggpubr package, Version 0.4.0; ggplot2 package, Version 3.3.3) or SPSS. The statistical significance was defined as p<0.05 (two-tails).
Over 300 million cellular objects from 1085 diagnostic slides of 1017 TCGA-BRCA patients were recognized and delineated by an unsupervised feature learning pipeline based on SPSD[24]. Each cellular object was represented with 15 morphometric properties as described in our previous work[10].
Next, we optimized and trained our SPSD model based on pre-quantified cellular objects randomly selected from the TCGA-BRCA cohort to discover the underlying cellular morphometric biomarkers (CMBs). After training, the prebuilt SPSD model reconstructed each cellular object as a sparse combination of the pre-identified 256 cellular morphometric biomarkers, which led to the novel representation of every single cellular object as 256 sparse code (reconstruction coefficient); and thereafter, the corresponding 256-dimensional cellular morphometric context representation of each patient as an aggregation of all delineated cellular objects belonging to the same patient (Supplementary Table 1). The final patient-level cellular morphometric context representation consisted of 256 CMBs.
We next evaluated the association of 256 CMBs with OS in the TCGA-BRCA cohort. Survival analysis revealed that 148 of 256 CMBs had a significant prognostic impact (p < 0.05, Supplementary Table 2). Among these 148 CMBs, 39 CMBs demonstrated independent and significant association with OS by multivariate CoxPH regression analysis (Figure 2A; Supplementary Figure 1; Supplementary Table 3), which were defined as a 39-CMB signature.

To further evaluate the prognostic value of the 39-CMB signature, we constructed the cellular morphometric prognosis score (CMPS) (see Methods) and divided TCGA-BRCA cohort into three groups (Poor: top third; Intermediate: middle third; and Good: bottom third) based on CMPS (Supplementary Table
Omics analyses of cancers have further revealed their genomic heterogeneity. FDA has approved many genomic biomarkers for clinical use, such as PAM50. Based on the omics data, we have previously identified 12-gene[21] and 15-microbe signatures[19] for the prognosis of BC patients (SupplementaryTable 3). We conducted a multivariate Cox regression analysis to address whether GMPS, MAPS, and GEPS are independent prognostic factors. Indeed, CMPS, MAPS, and GEPS were significantly and independently associated with OS (Figure 2D). We then integrated 39 CMBs, 15 microbes, and 12 genes in an unsupervised representation framework (“iCEMIGE”) and mined 256 multi-modal biomarkers (Supplementary Table 3) with experimentally optimized parameters for C-index for OS (Supplementary Figure 3). The optimal iCEMIGE score was then constructed to assess a patient’s risk for death and disease progression (Supplementary Table 4, details see Materials and Methods).
A total of 919 BC patients in the TCGA-BRCA cohort with full signature (iCEMIGE) data were included in this evaluation (Supplementary Table 5). 919 BC patients were stratified into different prognostic groups (Poor: top third; Intermediate: middle third; and Good: bottom third) according to the iCEMIGE score. Patients within the poor prognosis group had significantly shorter OS compared to those within the intermediate and good prognosis groups (P = 4.02E-58, Figure 3A). Importantly, we showed that the iCEMIGE score was more effective in predicting OS of BC patients than CMPS, MAPS, and GEPS alone (Figure 3B and C; Supplementary Figure 2A and B). Moreover, we found that the iCEMIGE score was also significantly associated with PFS (P = 2.40E-19, Figure 3D) and had more effective in predicting PFS (Figure 3E and F; Supplementary Figure 2C and D).

We then evaluated whether the prognostic value of the iCEMIGE score was independent of ER status, stage, and molecular subtypes. As shown in Figure 4A, patients with poor iCEMIGE scores had significantly shorter OS and PFS compared to those with good iCEMIGE scores in both ER+ and ER- groups. Moreover, the iCEMIGE score was significantly associated with OS and PFS in all different stages (Figure 4B) and subtypes (Figure 5).


Finally, using multivariate Cox regression analyses (including pathological stage, age, PR status, ER status, molecular subtype, iCEMIGE), we demonstrated that iCEMIGE was an independent prognostic factor for both OS (Figure 6A) and PFS (Supplementary Figure 4A). These findings indicate that the iCEMIGE score has an independent prognostic value in BCs.

To further assess the clinical value of the iCEMIGE score, we established a nomogram model, a valuable clinical tool for prognosis prediction, where we integrated iCEMIGE with clinical factors (age, stage, ER, and PR), PAM50-based molecular subtypes to predict the 5- and 10-year OS probability of BC patient (Figure 6B). The iCEMIGE score significantly improved the predictive power of prognosis (Figure 6C). Similar results were found for PFS (Supplementary Figure 4B and C).
High BC heterogeneity brings up a significant challenge for predicting a patient’s response to treatment or prognosis. In this study, we established a new strategy for tackling this challenge by integrating multimodal signatures and demonstrated that such approach significantly improved the power for prognostic prediction compared to the single modal biomarker. In addition, we showed that iCEMIGE is significantly superior in predicting OS and PFS compared to the PAM50-based molecular subtype in the TCGA-BRCA cohort, although additional validation is required, as stated later in the limitations of this study.
The majority of biomarker developments are limited to a single modal data[20]. In the past, we followed the same path to define the 12-gene expression prognosis score (GEPS)[21] and the 15-microbe abundance prognosis score (MAPS)[19] in BC. Here, we developed the 39-CMB prognosis score (CMPS) using an AI-driven CMB detection technique[10]. We found that CMPS, MAPS, and GEPS had an independent prognostic value. This suggests that different modal data provide unique clinical value for prognosis prediction and raises the possibility that integrating multimodal biomarkers can advance precision oncology by more accurately predicting the risk of treatment failure, relapse etc.
Integrating multimodal data to yield improved performance compared with each modality alone remains challenging. In this study, we presented a multi-step approach to integrate cellular morphometric, molecular, and microbiome landscapes into a multimodal prognostic system for BC. Firstly, we identified the biomarker signature and systematically assessed its prognostic value in each type of modal data. Secondly, we investigated whether these modal-specific biomarker signatures are independent prognostic factors. Thirdly, we established the final predictive model incorporating all modal biomarker signatures with significantly improved prognostic risk stratification compared with each modality alone. Finally, we systematically evaluated the clinical value of the final predictive model. Such a strategy can extend to other types of cancers.
Modern clinical instruments are generating massive amounts of multimodal data, including radiology, histology, and molecular data, where each of them provides unique value for cancer diagnosis and treatment. Therefore, the efficient and effective integration of multimodal data becomes critical and, however, remains challenging in terms of robustness, interpretability, and translational impact, even with the current advancesin artificial intelligence techniques[26-28]. Two major trends in multimodal integration in cancer research are modal-specific raw data integration (MDI)[29,30] and modal-specific representation integration (MRI)[31,32]. The MDI strategy handles each modality (e.g., histology and genomics) using different neural network structures and then combines the corresponding output of each neural network branch in subsequent network layers to predict the health outcome. Trained in an end-to-end fashion (i.e., black-box fashion), this strategy delivers a convenient and powerful utilization of information and interaction across modalities; however, in general, it lacks biomedical interpretability. In addition, such a strategy does not guarantee the learning of clinically significant and independent information per each modality, and thus the alternative deployment of an individual modality or a subset of modalities is nearly impossible.
In contrast, the MRI provides a stepwise strategy, where the first step consists of outcome-driven representation mining per modality, and the second step integrates modal-specific representation towards the outcome. Obviously, MRI is more likely (without guarantee) to mine model-specific representation with independent clinical value via a stepwise mechanism and consequently provides more flexibility in individual/subset modality deployment. This flexibility is important in clinical practice, especially when all modalities are not available. Extended from the MRI strategy, our work realizes the modal-specific knowledge integration (MKI) by enforcing the mining and utilization of biomedically interpretable, clinically significant and independent, and double-blindly validated knowledge (i.e., cellular morphometric biomarkers, microbiome biomarkers, and genomic biomarkers) through an AI-powered systems biology workflow for maximized clinical implications and translation impact.
Our study established a new promising strategy for integrating multimodal data to enhance prognostic prediction. A significant limitation was that we did not have independent cohorts to validate our findings. In addition, due to the limited clinical information in the TCGA-BRCA cohort, we were unable to comprehensively explore the potential confounding clinical factors, including tumor size, different cancer treatments, etc. The clinical utility of iCEMIGE needs to be further validated in retrospective and prospective cohort studies to determine whether the iCEMIGE score can provide sufficient predictive information to stratify patients by risk and guide treatment. If so, the iCEMIGE score could assist clinicians in decision-making about cancer treatment and enable more personalized cancer therapy.
Our study demonstrates a novel and generic AI framework for multimodal data integration toward improving prognosis risk stratification of BC patients, which can be extended to other types of cancer.
To develop a strategy to integrate multimodal data and to investigate whether iCEMIGE (integration of cell-morphometrics, microbiome, and gene biomarker signatures) improves the risk stratification of breast cancer patients.
Modern clinical instruments are generating massive amounts of multimodal data, including radiology, histology, and molecular data, where each of them provides unique value for cancer diagnosis and treatment. Efficient and effective integration of these multimodal data is believed to open a new era for precision oncology.
Cancer heterogeneity consistently results in a large variation in clinical outcomes of patients after treatment. The discovery of biomarkers for tailoring cancer treatments is a critical step toward personalized medicine.
The iCEMIGE score could assist clinicians in decision-making about cancer treatment and enable more personalized cancer therapy.
Our study indicates that multimodal integration (iCEMIGE) can more accurately predict the prognostic risk of breast cancer patients.
iCEMIGE is significantly superior in predicting overall and progression-free survival of breast cancer patients compared to single modal biomarker and the PAM50-based molecular subtype, which is one of FDA approved biomarkers and is currently used in clinical practice.
The artificial intelligence pipeline powered is used to identify cellular morphometric biomarkers. Single modal biomarker signatures are integrated using the sparse representation learning technique to establish iCEMIGE. Clinical value of iCEMIGE is evaluated using different statistical methods.
Provenance and peer review: Unsolicited article; Externally peer reviewed.
Peer-review model: Single blind
Specialty type: Oncology
Country/Territory of origin: United States
Peer-review report’s scientific quality classification
Grade A (Excellent): A
Grade B (Very good): B
Grade C (Good): 0
Grade D (Fair): 0
Grade E (Poor): 0
P-Reviewer: Hou L, China; Lu H, China A-Editor: Liu X, China S-Editor: Liu JH L-Editor: A P-Editor: Wu RR
| 1. | Allison KH, Sledge GW. Heterogeneity and cancer. Oncology (Williston Park). 2014;28:772-778. [PubMed] [Cited in This Article: ] |
| 2. | Dagogo-Jack I, Shaw AT. Tumour heterogeneity and resistance to cancer therapies. Nat Rev Clin Oncol. 2018;15:81-94. [PubMed] [DOI] [Cited in This Article: ] [Cited by in Crossref: 1349] [Cited by in F6Publishing: 1698] [Article Influence: 242.6] [Reference Citation Analysis (0)] |
| 3. | Bardakjian T, Gonzalez-Alegre P. Towards precision medicine. Handb Clin Neurol. 2018;147:93-102. [PubMed] [DOI] [Cited in This Article: ] [Cited by in Crossref: 10] [Cited by in F6Publishing: 11] [Article Influence: 1.8] [Reference Citation Analysis (0)] |
| 4. | Carels N, Spinassé LB, Tilli TM, Tuszynski JA. Toward precision medicine of breast cancer. Theor Biol Med Model. 2016;13:7. [PubMed] [DOI] [Cited in This Article: ] [Cited by in Crossref: 37] [Cited by in F6Publishing: 39] [Article Influence: 4.9] [Reference Citation Analysis (0)] |
| 5. | Middleton G, Robbins H, Andre F, Swanton C. A state-of-the-art review of stratified medicine in cancer: towards a future precision medicine strategy in cancer. Ann Oncol. 2022;33:143-157. [PubMed] [DOI] [Cited in This Article: ] [Cited by in Crossref: 26] [Cited by in F6Publishing: 23] [Article Influence: 11.5] [Reference Citation Analysis (0)] |
| 6. | Tsimberidou AM, Fountzilas E, Nikanjam M, Kurzrock R. Review of precision cancer medicine: Evolution of the treatment paradigm. Cancer Treat Rev. 2020;86:102019. [PubMed] [DOI] [Cited in This Article: ] [Cited by in Crossref: 252] [Cited by in F6Publishing: 258] [Article Influence: 64.5] [Reference Citation Analysis (0)] |
| 7. | Louie AD, Huntington K, Carlsen L, Zhou L, El-Deiry WS. Integrating Molecular Biomarker Inputs Into Development and Use of Clinical Cancer Therapeutics. Front Pharmacol. 2021;12:747194. [PubMed] [DOI] [Cited in This Article: ] [Cited by in Crossref: 5] [Cited by in F6Publishing: 5] [Article Influence: 1.7] [Reference Citation Analysis (0)] |
| 8. | Parker JL, Kuzulugil SS, Pereverzev K, Mac S, Lopes G, Shah Z, Weerasinghe A, Rubinger D, Falconi A, Bener A, Caglayan B, Tangri R, Mitsakakis N. Does biomarker use in oncology improve clinical trial failure risk? Cancer Med. 2021;10:1955-1963. [PubMed] [DOI] [Cited in This Article: ] [Cited by in Crossref: 7] [Cited by in F6Publishing: 7] [Article Influence: 2.3] [Reference Citation Analysis (0)] |
| 9. | Perez EA. Biomarkers and Precision Medicine in Oncology Practice and Clinical Trials. 2019 Dec 13. In: Advancing the Science of Cancer in Latinos [Internet]. Cham (CH): Springer; 2020. [PubMed] [Cited in This Article: ] |
| 10. | Liu X-P, Jin X, Ahmadian S, Yang X, Tian S-F, Cai Y-X, Chawla K, Snijders A, Xia Y, Diest P, Weiss W, Mao J-H, Li Z-Q, Vogel H, Chang H. Clinical Significance and Molecular Annotation of Cellular Morphometric Subtypes in Lower Grade Gliomas discovered by Machine Learning. Neuro Oncology. 2022;18:154. [PubMed] [DOI] [Cited in This Article: ] [Cited by in Crossref: 3] [Cited by in F6Publishing: 13] [Article Influence: 6.5] [Reference Citation Analysis (0)] |
| 11. | Chang H, Yang X, Moore J, Liu XP, Jen KY, Snijders AM, Ma L, Chou W, Corchado-Cobos R, García-Sancha N, Mendiburu-Eliçabe M, Pérez-Losada J, Barcellos-Hoff MH, Mao JH. From Mouse to Human: Cellular Morphometric Subtype Learned From Mouse Mammary Tumors Provides Prognostic Value in Human Breast Cancer. Front Oncol. 2021;11:819565. [PubMed] [DOI] [Cited in This Article: ] [Cited by in Crossref: 1] [Cited by in F6Publishing: 1] [Article Influence: 0.5] [Reference Citation Analysis (0)] |
| 12. | Turnquist C, Watson RA, Protheroe A, Verrill C, Sivakumar S. Tumor heterogeneity: does it matter? Expert Rev Anticancer Ther. 2019;19:857-867. [PubMed] [DOI] [Cited in This Article: ] [Cited by in Crossref: 5] [Cited by in F6Publishing: 5] [Article Influence: 1.0] [Reference Citation Analysis (0)] |
| 13. | Tarighati E, Keivan H, Mahani H. A review of prognostic and predictive biomarkers in breast cancer. Clin Exp Med. 2022;. [PubMed] [DOI] [Cited in This Article: ] [Cited by in Crossref: 14] [Cited by in F6Publishing: 14] [Article Influence: 14.0] [Reference Citation Analysis (0)] |
| 14. | Yadav BS, Chanana P, Jhamb S. Biomarkers in triple negative breast cancer: A review. World J Clin Oncol. 2015;6:252-263. [PubMed] [DOI] [Cited in This Article: ] [Cited by in CrossRef: 80] [Cited by in F6Publishing: 79] [Article Influence: 8.8] [Reference Citation Analysis (0)] |
| 15. | Sepich-Poore GD, Zitvogel L, Straussman R, Hasty J, Wargo JA, Knight R. The microbiome and human cancer. Science. 2021;371. [PubMed] [DOI] [Cited in This Article: ] [Cited by in Crossref: 395] [Cited by in F6Publishing: 427] [Article Influence: 142.3] [Reference Citation Analysis (0)] |
| 16. | Menati Rashno M, Mehraban H, Naji B, Radmehr M. Microbiome in human cancers. Access Microbiol. 2021;3:000247. [PubMed] [DOI] [Cited in This Article: ] [Cited by in Crossref: 2] [Cited by in F6Publishing: 1] [Article Influence: 0.3] [Reference Citation Analysis (0)] |
| 17. | Cullin N, Azevedo Antunes C, Straussman R, Stein-Thoeringer CK, Elinav E. Microbiome and cancer. Cancer Cell. 2021;39:1317-1341. [PubMed] [DOI] [Cited in This Article: ] [Cited by in Crossref: 92] [Cited by in F6Publishing: 172] [Article Influence: 57.3] [Reference Citation Analysis (0)] |
| 18. | Pham F, Moinard-Butot F, Coutzac C, Chaput N. Cancer and immunotherapy: a role for microbiota composition. Eur J Cancer. 2021;155:145-154. [PubMed] [DOI] [Cited in This Article: ] [Cited by in Crossref: 4] [Cited by in F6Publishing: 14] [Article Influence: 4.7] [Reference Citation Analysis (0)] |
| 19. | Mao AW, Barck H, Young J, Paley A, Mao J-, Chang H. Identification of a novel cancer microbiome signature for predicting prognosis of human breast cancer patients. Clin Transl Oncol. 2022;24:597-604. [PubMed] [DOI] [Cited in This Article: ] [Cited by in Crossref: 2] [Cited by in F6Publishing: 11] [Article Influence: 3.7] [Reference Citation Analysis (0)] |
| 20. | Boehm KM, Khosravi P, Vanguri R, Gao J, Shah SP. Harnessing multimodal data integration to advance precision oncology. Nat Rev Cancer. 2022;22:114-126. [PubMed] [DOI] [Cited in This Article: ] [Cited by in Crossref: 65] [Cited by in F6Publishing: 126] [Article Influence: 63.0] [Reference Citation Analysis (0)] |
| 21. | Mao XY, Lee MJ, Zhu J, Zhu C, Law SM, Snijders AM. Genome-wide screen identifies a novel prognostic signature for breast cancer survival. Oncotarget. 2017;8:14003-14016. [PubMed] [DOI] [Cited in This Article: ] [Cited by in Crossref: 16] [Cited by in F6Publishing: 17] [Article Influence: 2.4] [Reference Citation Analysis (0)] |
| 22. | Cerami E, Gao J, Dogrusoz U, Gross BE, Sumer SO, Aksoy BA, Jacobsen A, Byrne CJ, Heuer ML, Larsson E, Antipin Y, Reva B, Goldberg AP, Sander C, Schultz N. The cBio cancer genomics portal: an open platform for exploring multidimensional cancer genomics data. Cancer Discov. 2012;2:401-404. [PubMed] [DOI] [Cited in This Article: ] [Cited by in Crossref: 9144] [Cited by in F6Publishing: 10984] [Article Influence: 915.3] [Reference Citation Analysis (0)] |
| 23. | Gao J, Aksoy BA, Dogrusoz U, Dresdner G, Gross B, Sumer SO, Sun Y, Jacobsen A, Sinha R, Larsson E, Cerami E, Sander C, Schultz N. Integrative analysis of complex cancer genomics and clinical profiles using the cBioPortal. Sci Signal. 2013;6:pl1. [PubMed] [DOI] [Cited in This Article: ] [Cited by in Crossref: 8187] [Cited by in F6Publishing: 9904] [Article Influence: 900.4] [Reference Citation Analysis (0)] |
| 24. | Chang H, Zhou Y, Borowsky A, Barner K, Spellman P, Parvin B. Stacked Predictive Sparse Decomposition for Classification of Histology Sections. Int J Comput Vis. 2015;113:3-18. [PubMed] [DOI] [Cited in This Article: ] [Cited by in Crossref: 32] [Cited by in F6Publishing: 35] [Article Influence: 3.5] [Reference Citation Analysis (0)] |
| 25. | Yan H, Mao X, Yang X, Xia Y, Wang C, Wang J, Xia R, Xu X, Wang Z, Li Z. Development and Validation of an Unsupervised Feature Learning System for Leukocyte Characterization and Classification: A Multi-Hospital Study. Int J Comput Vision. 2021;129:1837-1856. [DOI] [Cited in This Article: ] [Cited by in Crossref: 4] [Cited by in F6Publishing: 3] [Article Influence: 1.0] [Reference Citation Analysis (0)] |
| 26. | Xia Y, Ji Z, Krylov A, Chang H, Cai W. Machine Learning in Multimodal Medical Imaging. Biomed Res Int. 2017;2017:1278329. [PubMed] [DOI] [Cited in This Article: ] [Cited by in Crossref: 4] [Cited by in F6Publishing: 5] [Article Influence: 0.7] [Reference Citation Analysis (0)] |
| 27. | Xu Y. Deep Learning in Multimodal Medical Image Analysis. In: Health Information Science: 2019// 2019; Cham: Springer International Publishing; 2019: 193-200. [DOI] [Cited in This Article: ] |
| 28. | Tran KA, Kondrashova O, Bradley A, Williams ED, Pearson JV, Waddell N. Deep learning in cancer diagnosis, prognosis and treatment selection. Genome Med. 2021;13:152. [PubMed] [DOI] [Cited in This Article: ] [Cited by in Crossref: 275] [Cited by in F6Publishing: 190] [Article Influence: 63.3] [Reference Citation Analysis (0)] |
| 29. |
Mobadersany P, Yousefi S, Amgad M, Gutman DA, Barnholtz-Sloan JS, Velázquez Vega JE, Brat DJ, Cooper LAD: Predicting cancer outcomes from histology and genomics using convolutional networks.
|
| 30. | Chaudhary K, Poirion OB, Lu L, Garmire LX. Deep Learning-Based Multi-Omics Integration Robustly Predicts Survival in Liver Cancer. Clin Cancer Res. 2018;24:1248-1259. [PubMed] [DOI] [Cited in This Article: ] [Cited by in Crossref: 483] [Cited by in F6Publishing: 472] [Article Influence: 78.7] [Reference Citation Analysis (0)] |
| 31. | Chang H, Fontenay GV, Han J, Cong G, Baehner FL, Gray JW, Spellman PT, Parvin B. Morphometic analysis of TCGA glioblastoma multiforme. BMC Bioinformatics. 2011;12:484. [PubMed] [DOI] [Cited in This Article: ] [Cited by in Crossref: 37] [Cited by in F6Publishing: 39] [Article Influence: 3.0] [Reference Citation Analysis (0)] |
| 32. | Cheng J, Zhang J, Han Y, Wang X, Ye X, Meng Y, Parwani A, Han Z, Feng Q, Huang K. Integrative Analysis of Histopathological Images and Genomic Data Predicts Clear Cell Renal Cell Carcinoma Prognosis. Cancer Res. 2017;77:e91-e100. [PubMed] [DOI] [Cited in This Article: ] [Cited by in Crossref: 61] [Cited by in F6Publishing: 70] [Article Influence: 10.0] [Reference Citation Analysis (0)] |