Copyright
©The Author(s) 2015.
World J Cardiol. Jun 26, 2015; 7(6): 315-325
Published online Jun 26, 2015. doi: 10.4330/wjc.v7.i6.315
Published online Jun 26, 2015. doi: 10.4330/wjc.v7.i6.315
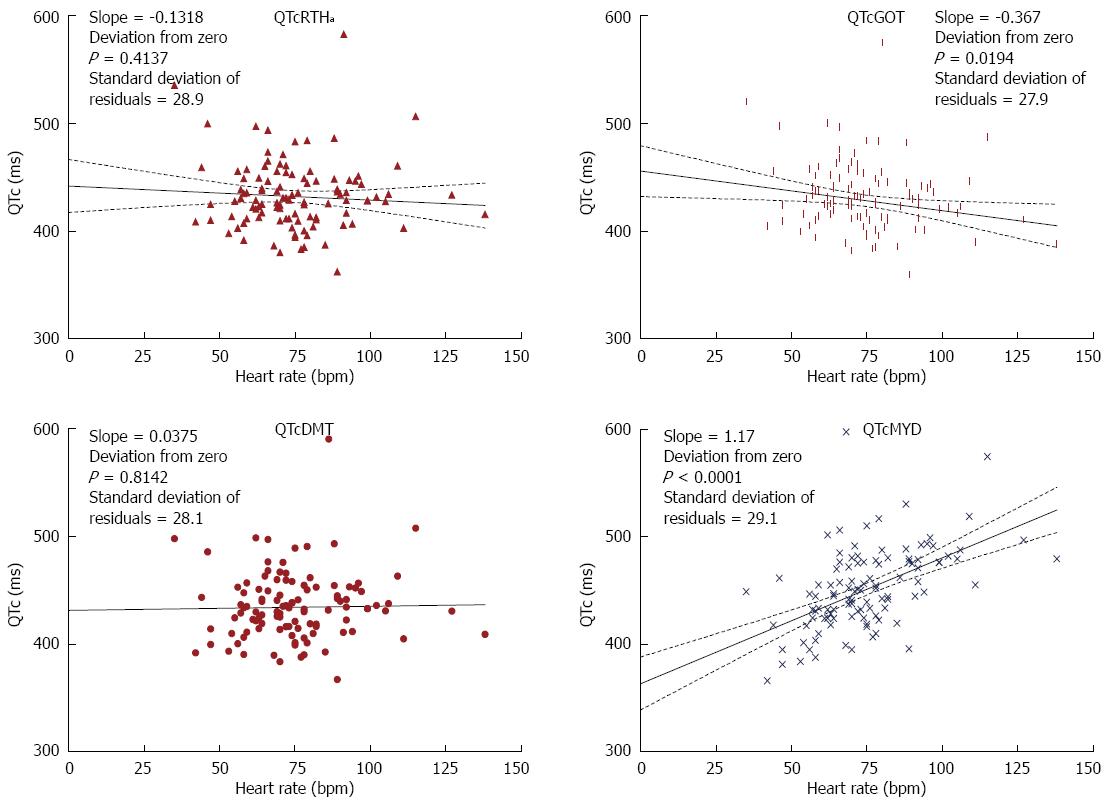
Figure 7 The relationship between QTc and heart rate for QTcRTHa, QTcDMT, QTcGOT, and QTcMYD.
The slope of the line and how significantly it deviates from zero is shown in the insert. The goodness of fit of the data to the linear regression (line) is shown by the standard deviation of residuals.
- Citation: Rabkin SW, Cheng XB. Nomenclature, categorization and usage of formulae to adjust QT interval for heart rate. World J Cardiol 2015; 7(6): 315-325
- URL: https://www.wjgnet.com/1949-8462/full/v7/i6/315.htm
- DOI: https://dx.doi.org/10.4330/wjc.v7.i6.315


