Copyright
©The Author(s) 2021.
World J Diabetes. Mar 15, 2021; 12(3): 278-291
Published online Mar 15, 2021. doi: 10.4239/wjd.v12.i3.278
Published online Mar 15, 2021. doi: 10.4239/wjd.v12.i3.278
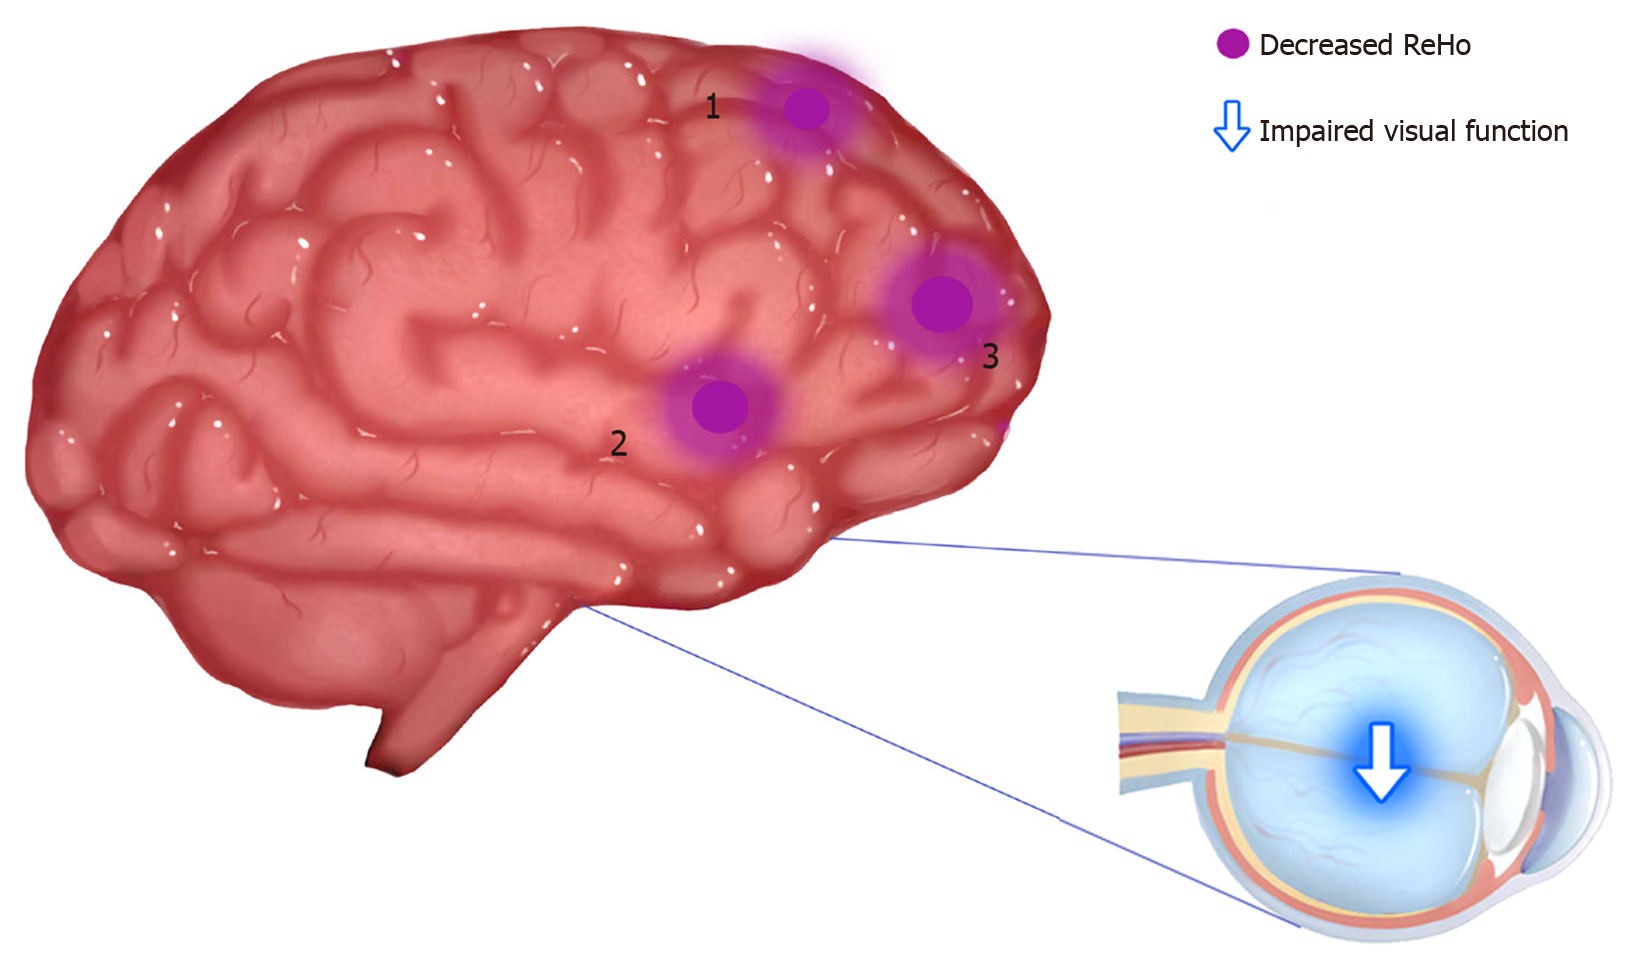
Figure 6 Regional homogeneity results of brain activity in the diabetic optic neuropathy group.
Compared with the healthy controls, the regional homogeneity values of regions 1-3 in diabetic optic neuropathy patients were decreased to various extents; region 1 refers to the superior frontal gyrus/left frontal superior orbital gyrus [Brodmann area (BA) 48; t = 4.0066], region 2 to the right middle frontal gyrus (BA 45; t = 4.4606), and region 3 to the left anterior cingulate (BA 32; t = 4.6582). ReHo: Regional homogeneity; 1: Superior frontal gyrus/left frontal superior orbital gyrus; 2: Right middle frontal gyrus; 3: Left anterior cingulate.
- Citation: Guo GY, Zhang LJ, Li B, Liang RB, Ge QM, Shu HY, Li QY, Pan YC, Pei CG, Shao Y. Altered spontaneous brain activity in patients with diabetic optic neuropathy: A resting-state functional magnetic resonance imaging study using regional homogeneity. World J Diabetes 2021; 12(3): 278-291
- URL: https://www.wjgnet.com/1948-9358/full/v12/i3/278.htm
- DOI: https://dx.doi.org/10.4239/wjd.v12.i3.278


