Copyright
©The Author(s) 2016.
World J Diabetes. Nov 15, 2016; 7(19): 534-546
Published online Nov 15, 2016. doi: 10.4239/wjd.v7.i19.534
Published online Nov 15, 2016. doi: 10.4239/wjd.v7.i19.534
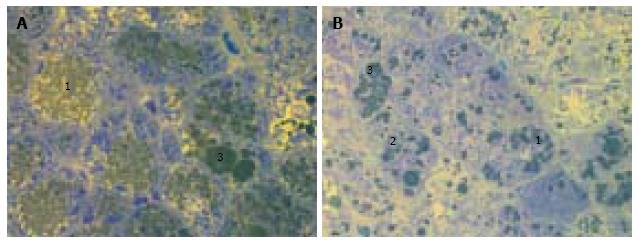
Figure 1 Liver histology in intact db/db mice.
A, B: Microvesicular (1) and mediovesicular (2) lipid accumulation, sporadic large lipid droplets in hepatocytes (3). Light microscopy with yellow filter of semi-thin sections stained with toluidine blue; magnification × 1000.
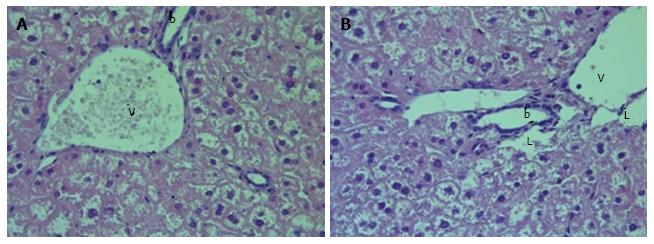
Figure 2 Liver histology in intact db/db mice.
A, B: The dilatation of intelobular arteries and veins (v), lymphatic vessels (L) and bile canaliculi (b) was present in most of histological preparations. H and E; magnification × 400.
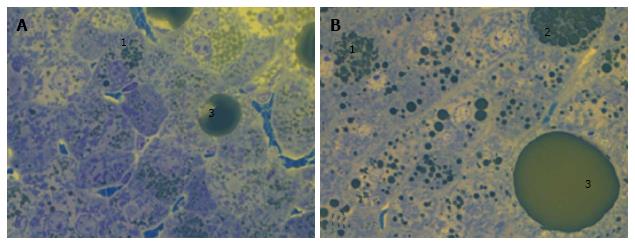
Figure 3 Liver histology in placebo-treated db/db diabetic mice.
A, B: Microvesicular (1) and mediovesicular (2) lipid accumulation, sporadic large lipid droplets in hepatocytes (3). Light microscopy with yellow filter of semi-thin sections stained with toluidine blue; magnification × 1000.
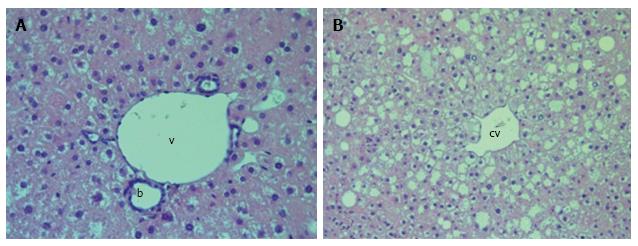
Figure 4 Liver histology in placebo-treated db/db mice.
A: Dilatation of the interlobular veins (v), lymphatic vessels and bile ducts (b). H and E; magnification × 400; B: Extension of the central vein (cv), vacuolar degeneration of hepatocytes. H and E; magnification × 200.
Figure 5 Liver histology in linagliptin-treated db/db diabetic mice.
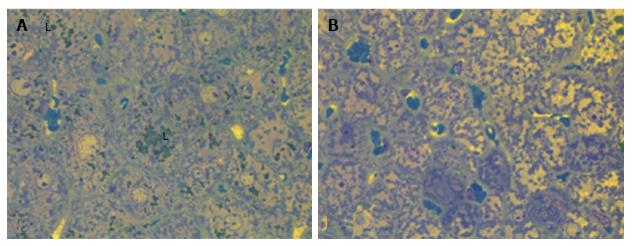
Heterogeneity of the changes of hepatocytes: A: Microvesicular lipid accumulation (L); B: No lipid accumulation. Light microscopy with yellow filter of semi-thin sections stained with toluidine blue; magnification × 1000.
Figure 6 The liver of linagliptin-treated db/db diabetic mouse.
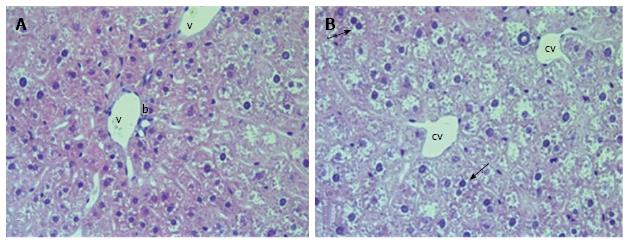
The dilatation of blood and lymphatic vessels of portal tracts, central veins was less profound. Numerous diplocariocytes were present (arrows). V: The vein of portal tract; b: Bile duct of portal tract; cv: Central vein. H and E; magnification × 400.
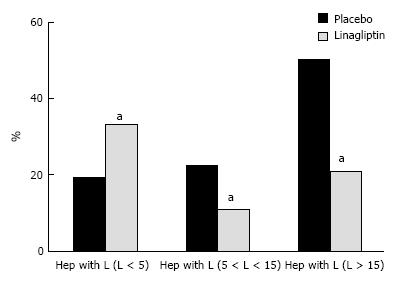
Figure 7 The mean proportions of hepatocytes with different densities of lipid droplets in linagliptin-treated and placebo-treated db/db mice.
The percent of hepatocytes with high density of lipid droplets (more than 15 droplets per cell) is reduced in linagliptin-treated mice compared to placebo-treated mice (hep, hepatocyte, L < 5, less than 5 lipid droplets per cell, L > 15, more than 15 lipid droplets per cell, aP < 0.05).
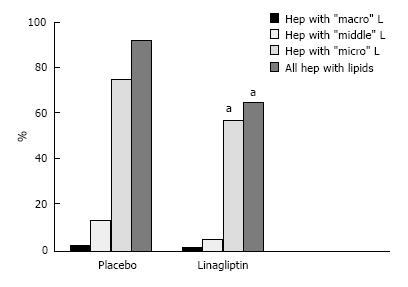
Figure 8 The distribution of hepatocytes with lipid inclusions depending on the size of lipid droplets in linagliptin-treated and placebo-treated db/db mice.
The reduction in the numeral density of hepatocytes with microsized, mediosized and macrosized droplets in linagliptin-treated mice (hep, hepatocyte, aP < 0.05 vs placebo group).
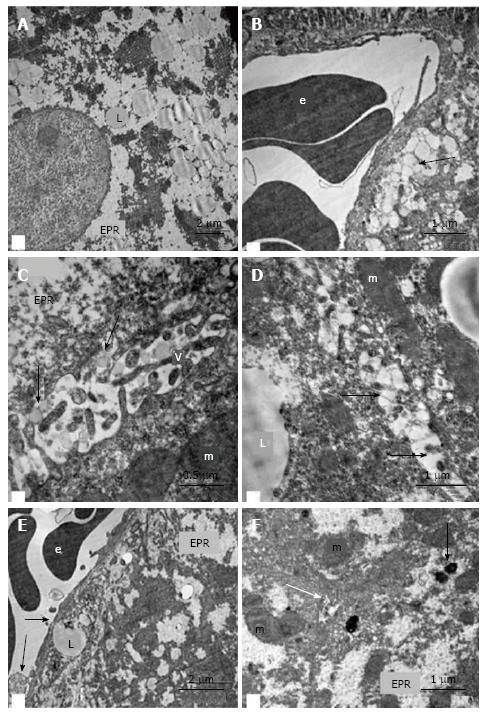
Figure 9 Ultrastructural changes in the hepatocytes of intact db/db mice.
A: Fields of “foamy” hyperplastic smooth ER and fields of glycogen, lipid inclusions in the cytoplasm of hepatocytes; B and E: Pronounced exocytosis of vacuoles with lipid content into the Disse space (arrows); C and D: Pronounced exocytosis of vacuoles with lipid content into gaps between hepatocytes (arrows); F: The bile capillary (white arrow) and compartments of the mito-ER-complexes (complexes from ER and mitochondria), active Golgi complexes, residual bodies and autophagosomes (black arrow) at the biliary poles of hepatocytes. V: Microvilli on the lateral surface of hepatocytes; L: Lipid inclusions; m: Mitochondria; e: Erythrocyte; EPR: Endoplasmic reticulum.
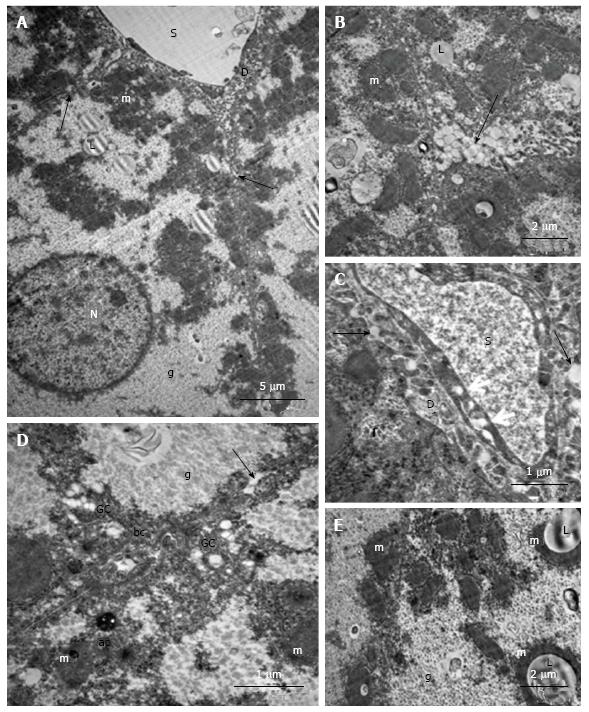
Figure 10 Ultrastructural changes in the hepatocytes of placebo-treated db/db mice.
A: Fatty degeneration, numerous compartments of mito-ER-complexes, free ribosomes and polysomes, pronounced hyperplasia of the microvilli on the vascular poles and lateral sites of parenchymal cells, enlarged Disse spaces; the arrows indicate the extension between the lateral surfaces of adjacent hepatocytes; B: Hyperplasia of microvilli on the lateral parts of the hepatocytes and transport of lipid inclusions (arrow) into spaces between hepatocytes; C: The transport of lipid inclusions into Disse spaces (arrows), transport vacuoles into the cytoplasm of endothelial sinusoidal cells; D: Active Golgi complexes, autophagosomes with dark content and ribosomes in peribiliary areas of hepatocytes; the arrow shows the transport of lipid inclusions into the gap between hepatocytes; E: Structural complexes of lipid inclusions with mitochondria. ap: Autophagosome; g: Glycogen granules; D: The Disse space; bc: Bile capillary; GC: Golgi complex; L: Lipid inclusion; m: Mitochondria; s: Lumen of the sinusoid; e: Erythrocyte; N: The nucleus.
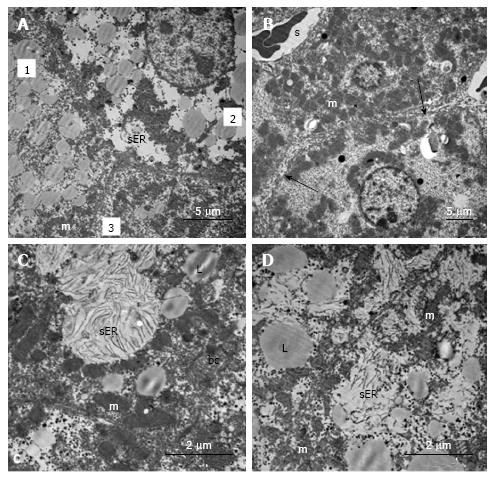
Figure 11 Ultrastructural changes in the hepatocytes of linagliptin-treated db/db mice.
A: Heterogeneity of the hepatocytes: Cells with numerous lipid inclusions (1), cells with areas of hyperplasia of smooth ER and lipid vacuoles (2), cells with a relatively uniform distribution of organelles and rare lipid inclusions (3); B: Cells without hyperplasia of the smooth ER with a relatively homogenous distribution of organelles; distinct microvilli on vascular poles of the hepatocytes and on the lateral sides of parenchymal cells; the extension of spaces between hepatocytes (arrows); C and D: Plots of clusters of smooth ER membranes. L: Lipid inclusion; m: Mitochondria; s: Lumen of the sinusoid; SER: Smooth endoplasmic reticulum; bc: Bile capillary.
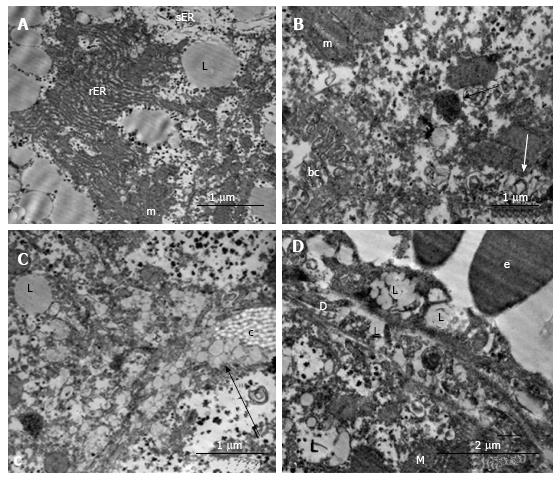
Figure 12 Ultrastructural changes in the hepatocytes of linagliptin-treated db/db mice.
A: The complexes from the mitochondria, rough ER and lipid droplets; B: Mitochondria with separate granular ER profiles, myelin structures (white arrow), autophagosomes with electrondark content and ribosomes (black arrow) nearby the bile capillaries with pronounced microvilli; C: The transport of lipids into the gaps between hepatocytes (arrow); D: Large vacuoles in the cytoplasm of endothelial cells in the sinusoids. rER: Rough endoplasmic reticulum; sER: Smooth endoplasmic reticulum; bc: Bile capillary; D: The Disse space; c: A tuft of collagen; L: Lipid inclusion; m: Mitochondria; e: Erythrocyte.
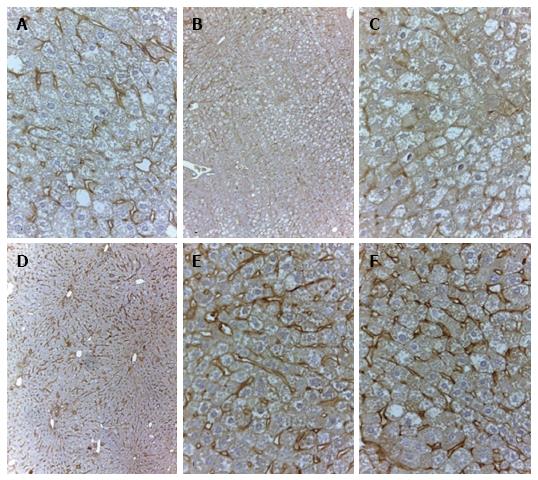
Figure 13 Immunohistochemical staining for lymphatic vessel endothelial hyaluronan receptor-1 in the liver of intact (A and B), placebo-treated (C) and linagliptin-treated (D, E and F) db/db mice.
Staining by anti-LYVE-1 antibodies, indirect streptavidin-biotin method; A, C, E and F: × 400; B and D: × 100. LYVE-1: Lymphatic vessel endothelial hyaluronan receptor-1.
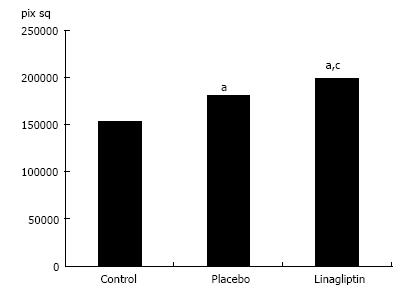
Figure 14 The area of immunohistochemical staining for lymphatic vessel endothelial hyaluronan receptor-1 in the liver of intact, placebo-treated and linagliptin-treated db/db mice.
aP < 0.05 vs control group (intact animals); cP < 0.05 vs placebo group. pix sq: Square pixel.
- Citation: Michurina SV, Ishenko IJ, Klimontov VV, Archipov SA, Myakina NE, Cherepanova MA, Zavjalov EL, Koncevaya GV, Konenkov VI. Linagliptin alleviates fatty liver disease in diabetic db/db mice. World J Diabetes 2016; 7(19): 534-546
- URL: https://www.wjgnet.com/1948-9358/full/v7/i19/534.htm
- DOI: https://dx.doi.org/10.4239/wjd.v7.i19.534


