Copyright
©The Author(s) 2022.
World J Gastrointest Oncol. Dec 15, 2022; 14(12): 2415-2421
Published online Dec 15, 2022. doi: 10.4251/wjgo.v14.i12.2415
Published online Dec 15, 2022. doi: 10.4251/wjgo.v14.i12.2415
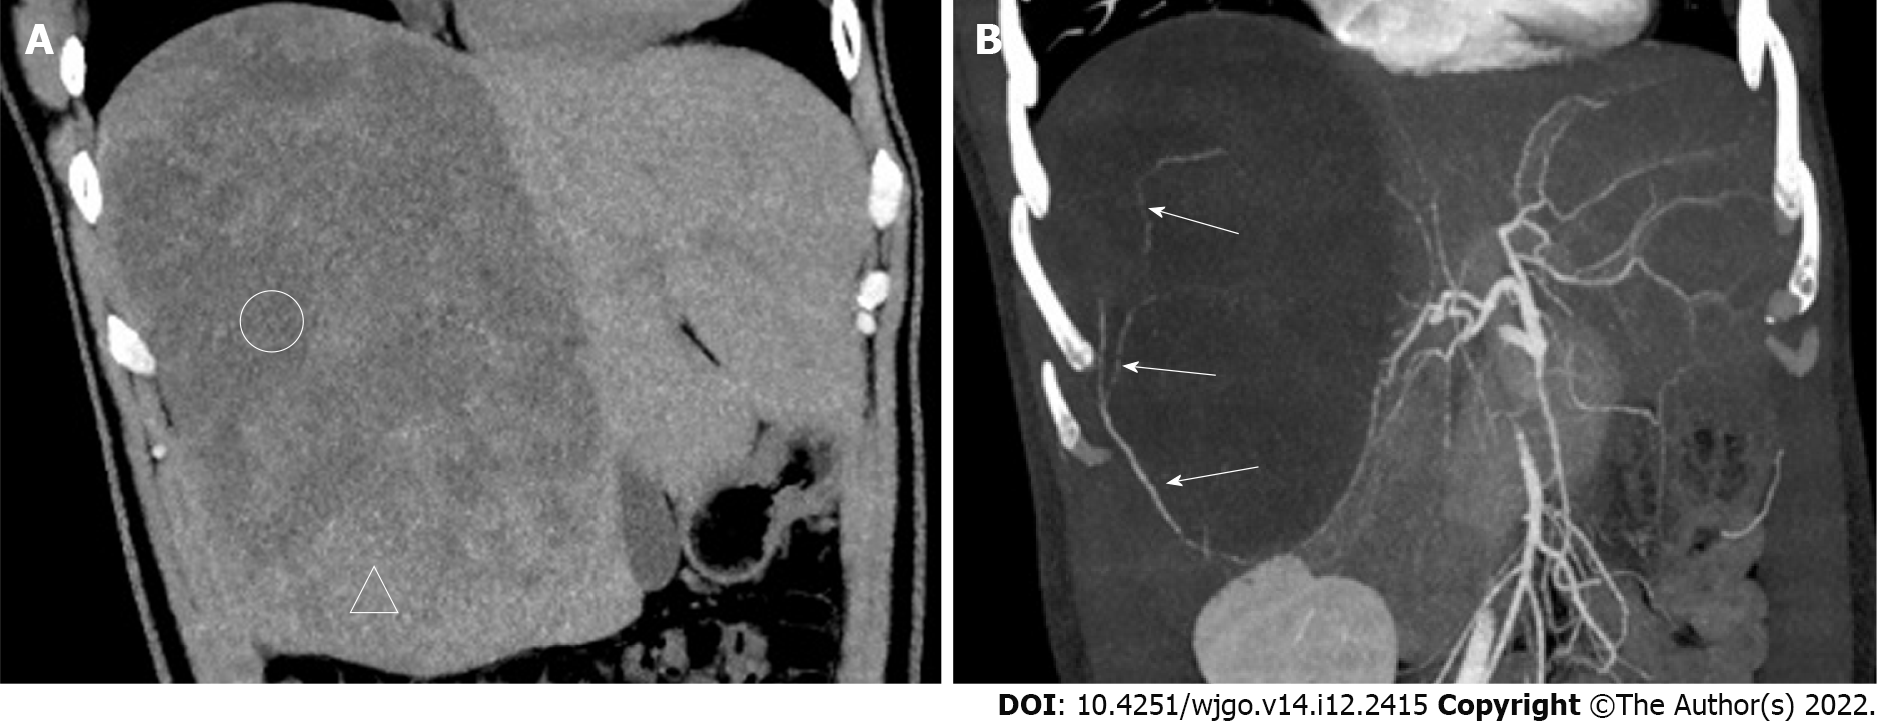
Figure 1 Computed tomography images.
A: Plain computed tomography (CT) coronary reconstruction image; B: CT-enhanced arterial phase maximum intensity projection (MIP) reconstruction image. Compared with the liver parenchyma, many areas of the lesions appear as low density (circled areas) on CT. The mass resembles a meteorite. The MIP image shows that the tumor-feeding artery originates from the right posterior hepatic artery, from bottom to top, with multiple branches (white long arrows in Figure 1B).
- Citation: Li DF, Guo XJ, Song SP, Li HB. Rare massive hepatic hemangioblastoma: A case report. World J Gastrointest Oncol 2022; 14(12): 2415-2421
- URL: https://www.wjgnet.com/1948-5204/full/v14/i12/2415.htm
- DOI: https://dx.doi.org/10.4251/wjgo.v14.i12.2415


