Copyright
©The Author(s) 2017.
World J Hepatol. Dec 28, 2017; 9(36): 1352-1360
Published online Dec 28, 2017. doi: 10.4254/wjh.v9.i36.1352
Published online Dec 28, 2017. doi: 10.4254/wjh.v9.i36.1352
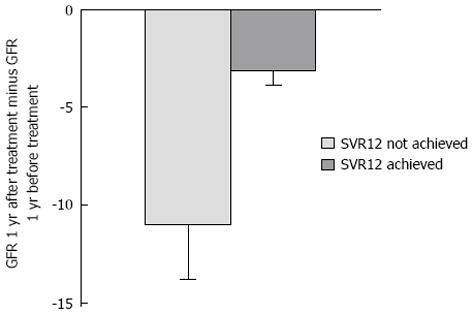
Figure 1 Rate of change in glomerular filtration rate one-year after hepatitis C virus treatment compared to one-year before treatment in relation to achievement of sustained virological response at 12 wk (P = 0.
002). GFR: Glomerular filtration rate; SVR12: Sustained virological response at 12 wk following therapy.
- Citation: Aby ES, Dong TS, Kawamoto J, Pisegna JR, Benhammou JN. Impact of sustained virologic response on chronic kidney disease progression in hepatitis C. World J Hepatol 2017; 9(36): 1352-1360
- URL: https://www.wjgnet.com/1948-5182/full/v9/i36/1352.htm
- DOI: https://dx.doi.org/10.4254/wjh.v9.i36.1352


