Copyright
©The Author(s) 2016.
World J Hepatol. Aug 18, 2016; 8(23): 994-998
Published online Aug 18, 2016. doi: 10.4254/wjh.v8.i23.994
Published online Aug 18, 2016. doi: 10.4254/wjh.v8.i23.994
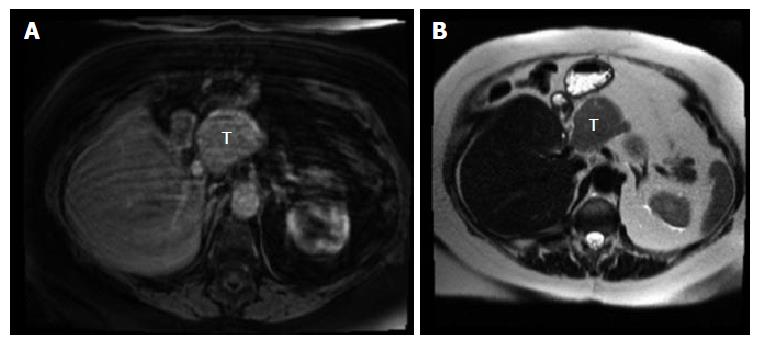
Figure 1 Suprapancreatic mass.
The left panel (A) shows an axial post contrast T1 fat suppressed sequence that demonstrates an arterial phase enhancing mass medial to the liver; the right panel (B) shows an axial T2 HASTE sequence demonstrating a mass with increased T2 signal medial to the liver. T: Tumor.
- Citation: Caparelli ML, Roberts NJ, Braverman TS, Stevens RM, Broun ER, Allamaneni S. Metastatic recurrence to a solitary lymph node four years after hepatic lobectomy for primary hepatocellular carcinoma. World J Hepatol 2016; 8(23): 994-998
- URL: https://www.wjgnet.com/1948-5182/full/v8/i23/994.htm
- DOI: https://dx.doi.org/10.4254/wjh.v8.i23.994


