Copyright
©The Author(s) 2015.
World J Hepatol. Jun 28, 2015; 7(12): 1632-1651
Published online Jun 28, 2015. doi: 10.4254/wjh.v7.i12.1632
Published online Jun 28, 2015. doi: 10.4254/wjh.v7.i12.1632
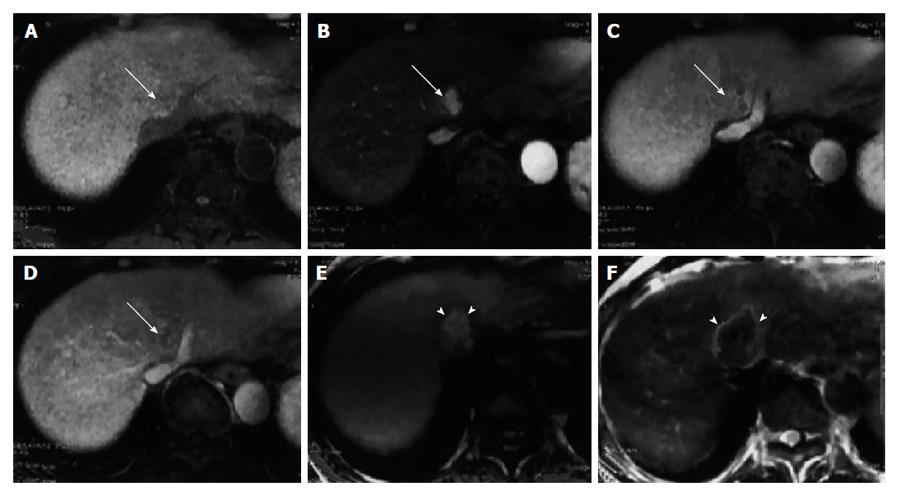
Figure 5 Dynamic magnetic resonance imaging of hepatocellular carcinoma.
A: Precontrast; B: Arterial phase; C: Portal venous phase; D: Equilibrium phase; dynamic magnetic resonance imaging obtained with the LAVA sequence prior to therapeutic treatment. The hepatocellular carcinoma (HCC) (arrow) is seen adjacent to the hepatic vein as an enhanced nodule in the late arterial phase and as hypo-attenuated nodule in the portal venous and equilibrium phases; E: T1-weighted gradient echo image; F: Spin echo T2-weighted image two days after radiofrequency ablation therapy for HCC. The completely ablated area shows as hyperintense on T1-weighted images and as hypointense on T2–weighted images (arrowheads)[66].
- Citation: Attwa MH, El-Etreby SA. Guide for diagnosis and treatment of hepatocellular carcinoma. World J Hepatol 2015; 7(12): 1632-1651
- URL: https://www.wjgnet.com/1948-5182/full/v7/i12/1632.htm
- DOI: https://dx.doi.org/10.4254/wjh.v7.i12.1632


