Copyright
©The Author(s) 2020.
World J Hepatol. Jul 27, 2020; 12(7): 363-377
Published online Jul 27, 2020. doi: 10.4254/wjh.v12.i7.363
Published online Jul 27, 2020. doi: 10.4254/wjh.v12.i7.363
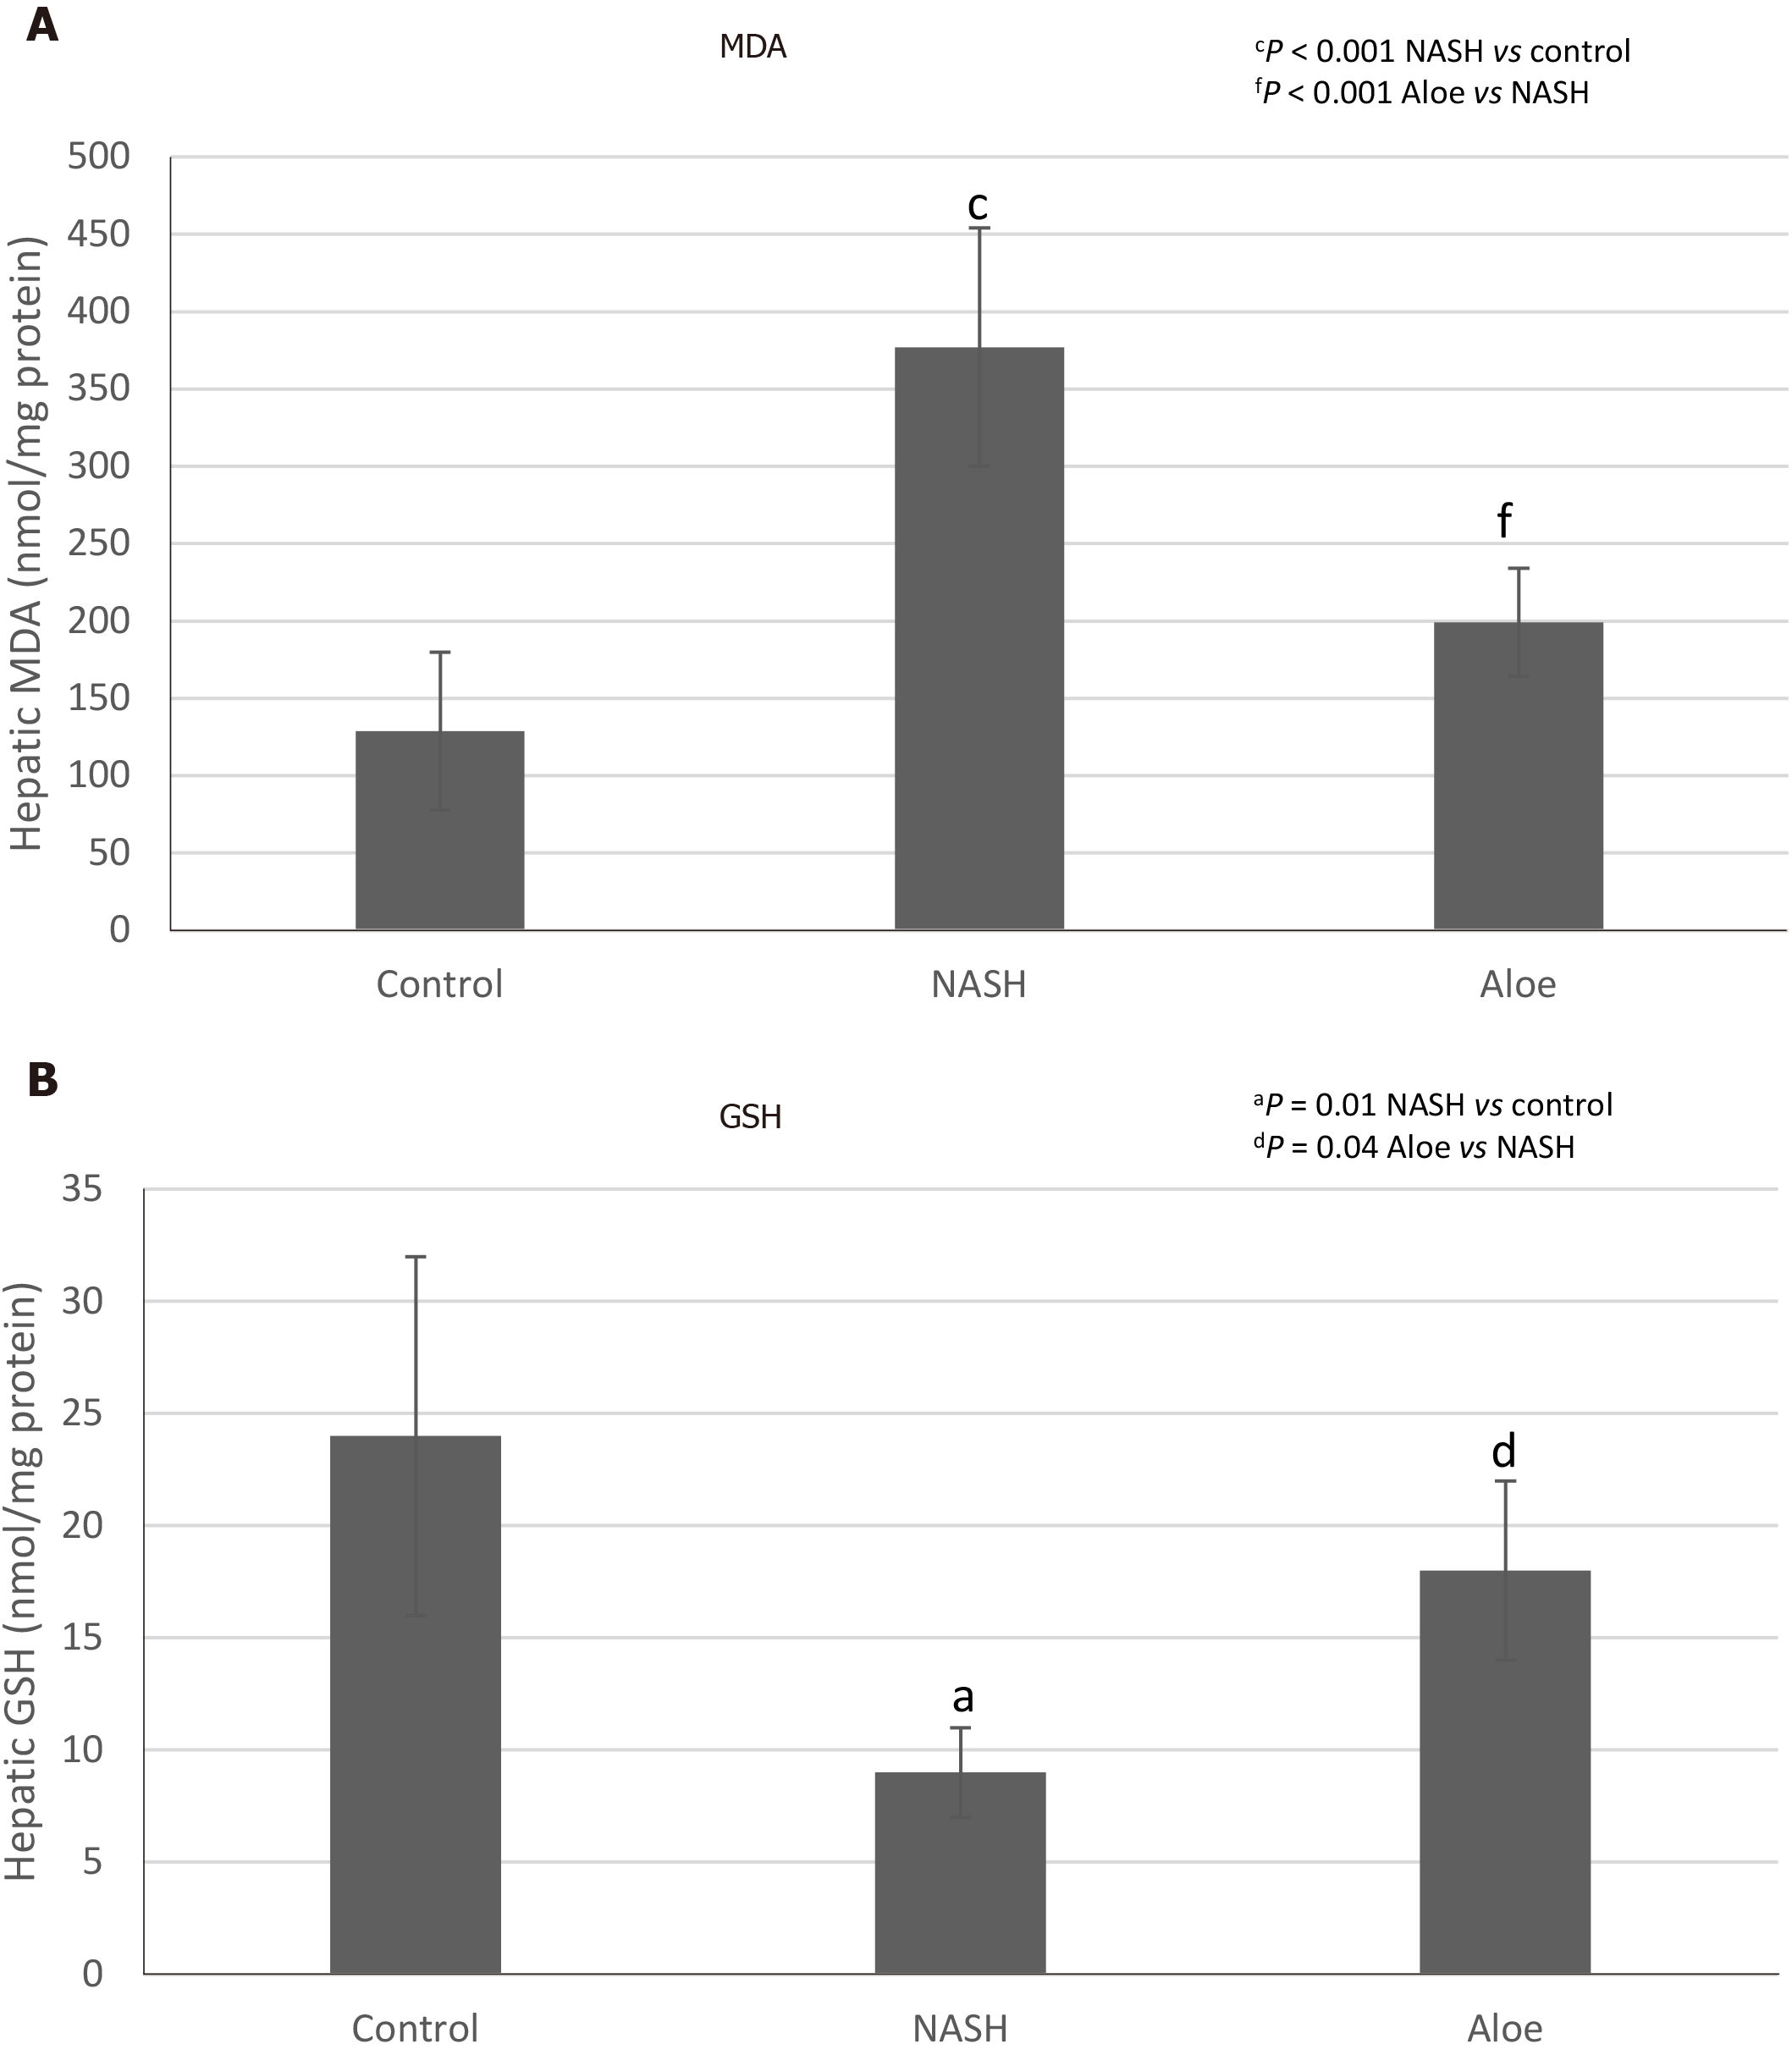
Figure 3 Hepatic malondialdehyde and glutathione levels in each group.
A: Malondialdehyde; B: Glutathione. Data are expressed as mean ± SD. NASH: Non-alcoholic steatohepatitis; MDA: Malondialdehyde; GSH: Glutathione.
- Citation: Klaikeaw N, Wongphoom J, Werawatganon D, Chayanupatkul M, Siriviriyakul P. Anti-inflammatory and anti-oxidant effects of aloe vera in rats with non-alcoholic steatohepatitis. World J Hepatol 2020; 12(7): 363-377
- URL: https://www.wjgnet.com/1948-5182/full/v12/i7/363.htm
- DOI: https://dx.doi.org/10.4254/wjh.v12.i7.363


