Copyright
©The Author(s) 2019.
World J Hepatol. Apr 27, 2019; 11(4): 359-369
Published online Apr 27, 2019. doi: 10.4254/wjh.v11.i4.359
Published online Apr 27, 2019. doi: 10.4254/wjh.v11.i4.359
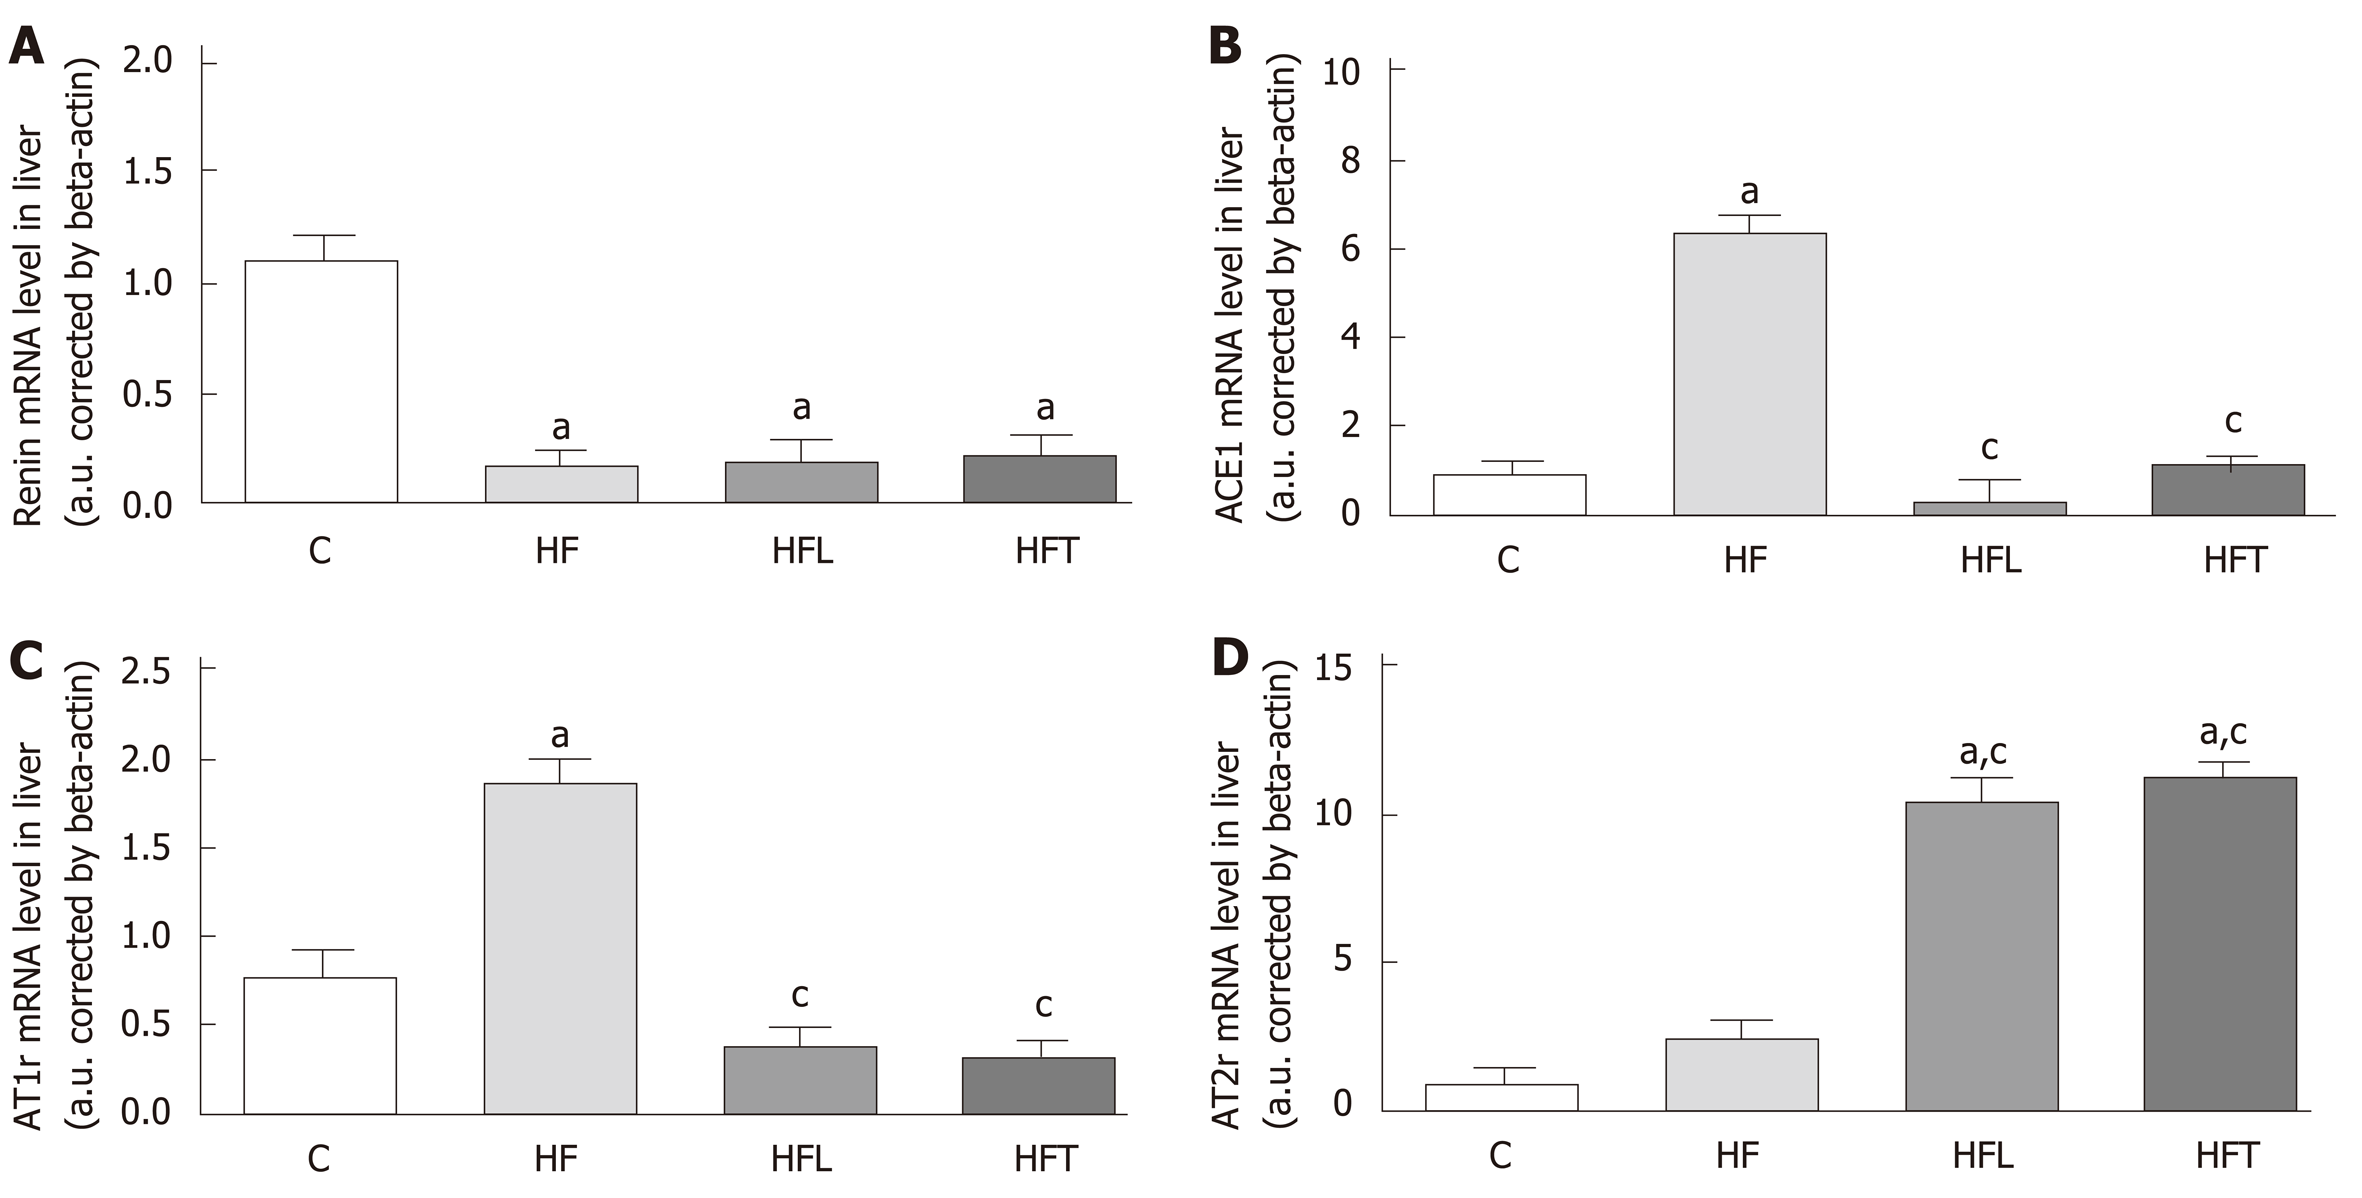
Figure 3 Local gene expression of components of the classical ACE1/AT1r axis in the liver: Renin (A), ACE1 (B), AT1r (C) and AT2r (B).
B-Actin was used as an endogenous control to normalize the expression of the selected genes. Data are the means ± SD, n = 5 for each group. Differences between the groups were tested with one-way ANOVA and post hoc test of Holm–Sidak (P < 0.05) when compared with the C group (a) and HF group (c). ACE1: Angiotensin-converting enzyme 1; AT1r: Angiotensin type-1 receptor; AT2r: Angiotensin type-2 receptor; C: Control group; HF: High-fat diet; HFL: HF diet treated with losartan; HFT: HF diet treated with telmisartan.
- Citation: Graus-Nunes F, Santos FO, Marinho TS, Miranda CS, Barbosa-da-Silva S, Souza-Mello V. Beneficial effects of losartan or telmisartan on the local hepatic renin-angiotensin system to counter obesity in an experimental model. World J Hepatol 2019; 11(4): 359-369
- URL: https://www.wjgnet.com/1948-5182/full/v11/i4/359.htm
- DOI: https://dx.doi.org/10.4254/wjh.v11.i4.359


