Copyright
©The Author(s) 2018.
World J Hepatol. Jan 27, 2018; 10(1): 142-154
Published online Jan 27, 2018. doi: 10.4254/wjh.v10.i1.142
Published online Jan 27, 2018. doi: 10.4254/wjh.v10.i1.142
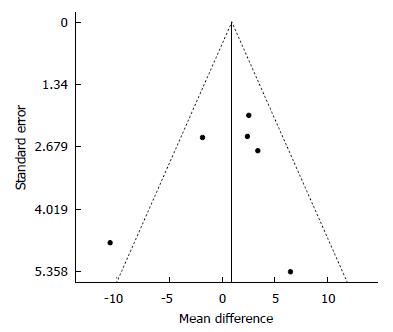
Figure 5 Funnel plot of standard error by differences in Means for 25(OH)D.
We analyzed the data for a possible publication bias. The circles represent observed published studies. The funnel plot was asymmetric, thereby suggesting a possible publication bias.
- Citation: Saberi B, Dadabhai AS, Nanavati J, Wang L, Shinohara RT, Mullin GE. Vitamin D levels do not predict the stage of hepatic fibrosis in patients with non-alcoholic fatty liver disease: A PRISMA compliant systematic review and meta-analysis of pooled data. World J Hepatol 2018; 10(1): 142-154
- URL: https://www.wjgnet.com/1948-5182/full/v10/i1/142.htm
- DOI: https://dx.doi.org/10.4254/wjh.v10.i1.142


