Copyright
©The Author(s) 2020.
World J Hepatol. Nov 27, 2020; 12(11): 976-992
Published online Nov 27, 2020. doi: 10.4254/wjh.v12.i11.976
Published online Nov 27, 2020. doi: 10.4254/wjh.v12.i11.976
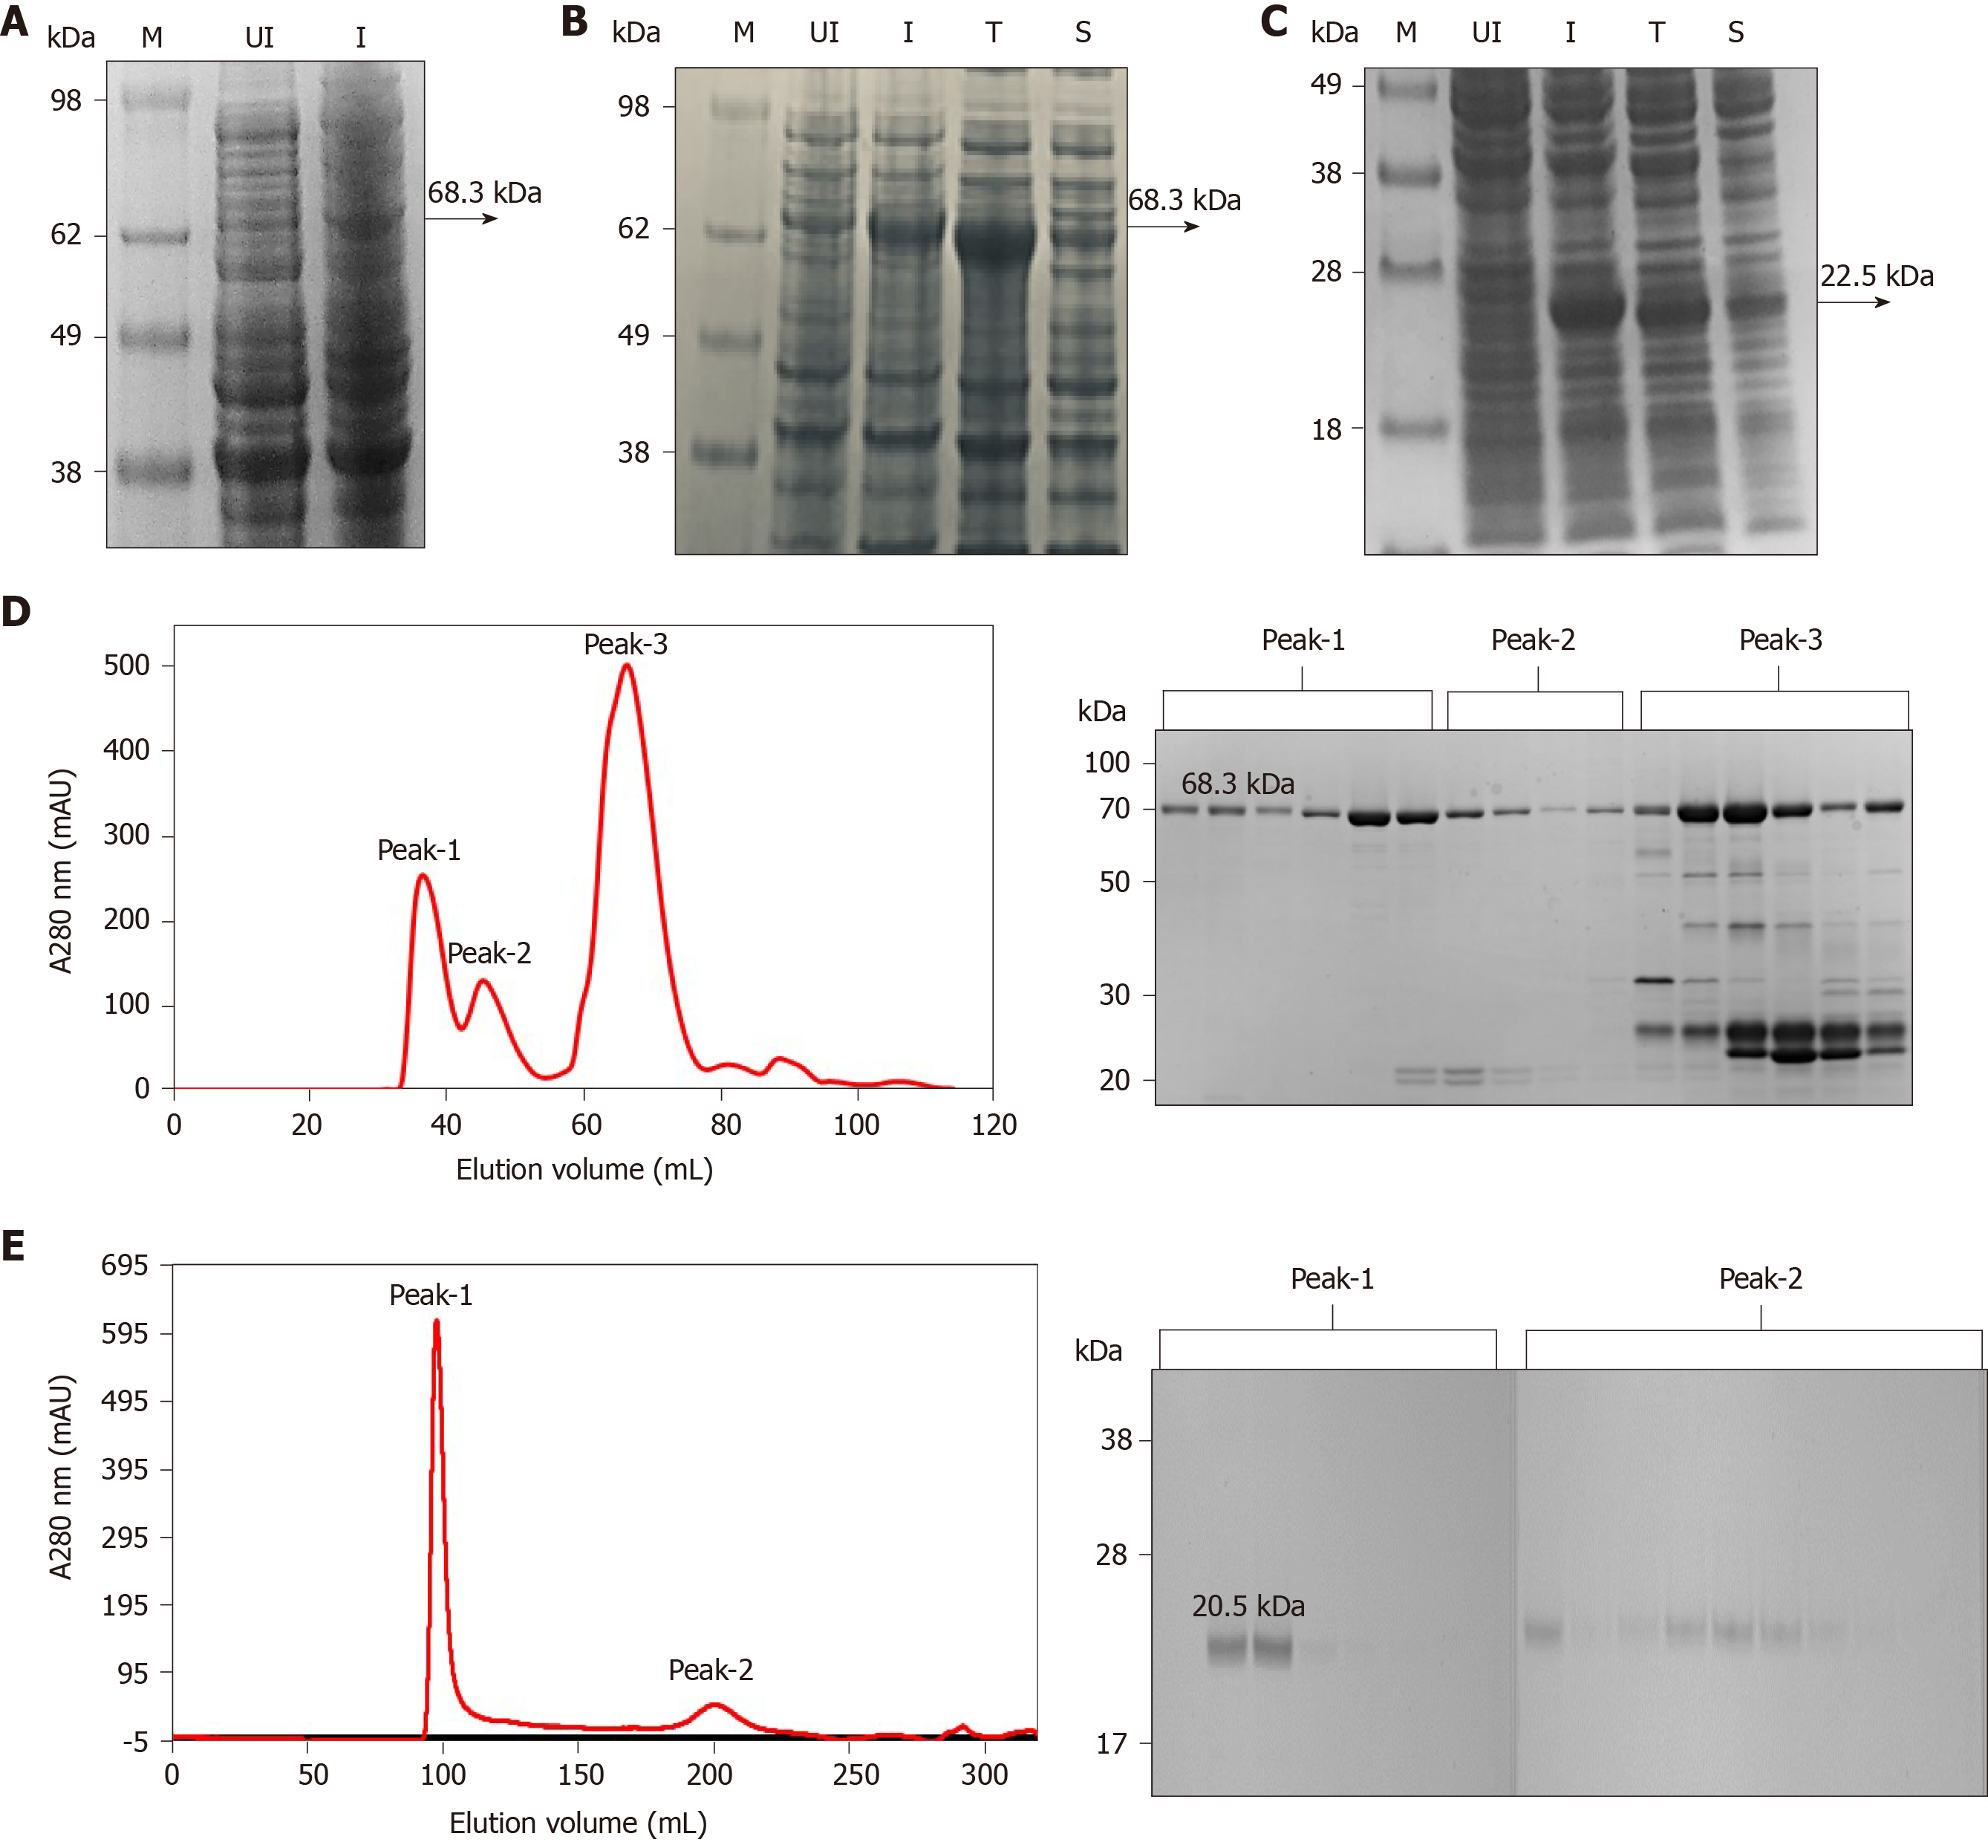
Figure 1 Expression and purification of full-length His6-NS3 and non-structural protein 4a-non-structural protein 3 protease domain.
A: Analysis of the full-length His6–NS3 protein (68.3 kDa) expressed in Escherichia coli BL21 (DE3) using pET11a-His6-NS3. Lane M: SeeBlueTM Pre-Stained Protein Marker (LC5625); Lane UI: Uninduced BL21 (DE3) cells and Lane I: Induced BL21 (DE3) cells; B: Analysis of soluble and insoluble fractions of the His6–NS3 protein expressed in E. coli BL21-CodonPlus (DE3)-RIL cells using pET11a-His6-NS3. Lane M: Invitrogen Cat 1891868 See Blue® Plus2 Pre-Stained ladder; Lane UI: Uninduced cells; Lane I: Induced cells; Lane T: Total cell lysate of induced cells; Lane S: Soluble fraction of lysed cells; C: Analysis of soluble and insoluble fractions of the His7–non-structural protein 4a-non-structural protein 3 (NS4A-NS3) protease domain expressed in E. coli BL21 (DE3) cells using pET11a-His7-NS4A-NS3. Lane M: SeeBlueTM Pre-Stained Protein Marker (LC5625); Lane UI: Uninduced cells; Lane I: Induced cells; Lane T: Total cell lysate of induced cells; Lane S: Soluble fraction of lysed cells; D: Analysis of the Ni-NTA His6–NS3 protein by gel filtration, presence of proteins in peak 1, 2 and 3 is analyzed by sodium dodecyl sulfate polyacrylamide gel electrophoresis; and E: Analysis of the native NS4–NS3 protease domain by gel filtration, presence of proteins in peak 1 and 2 is analyzed by sodium dodecyl sulfate polyacrylamide gel electrophoresis.
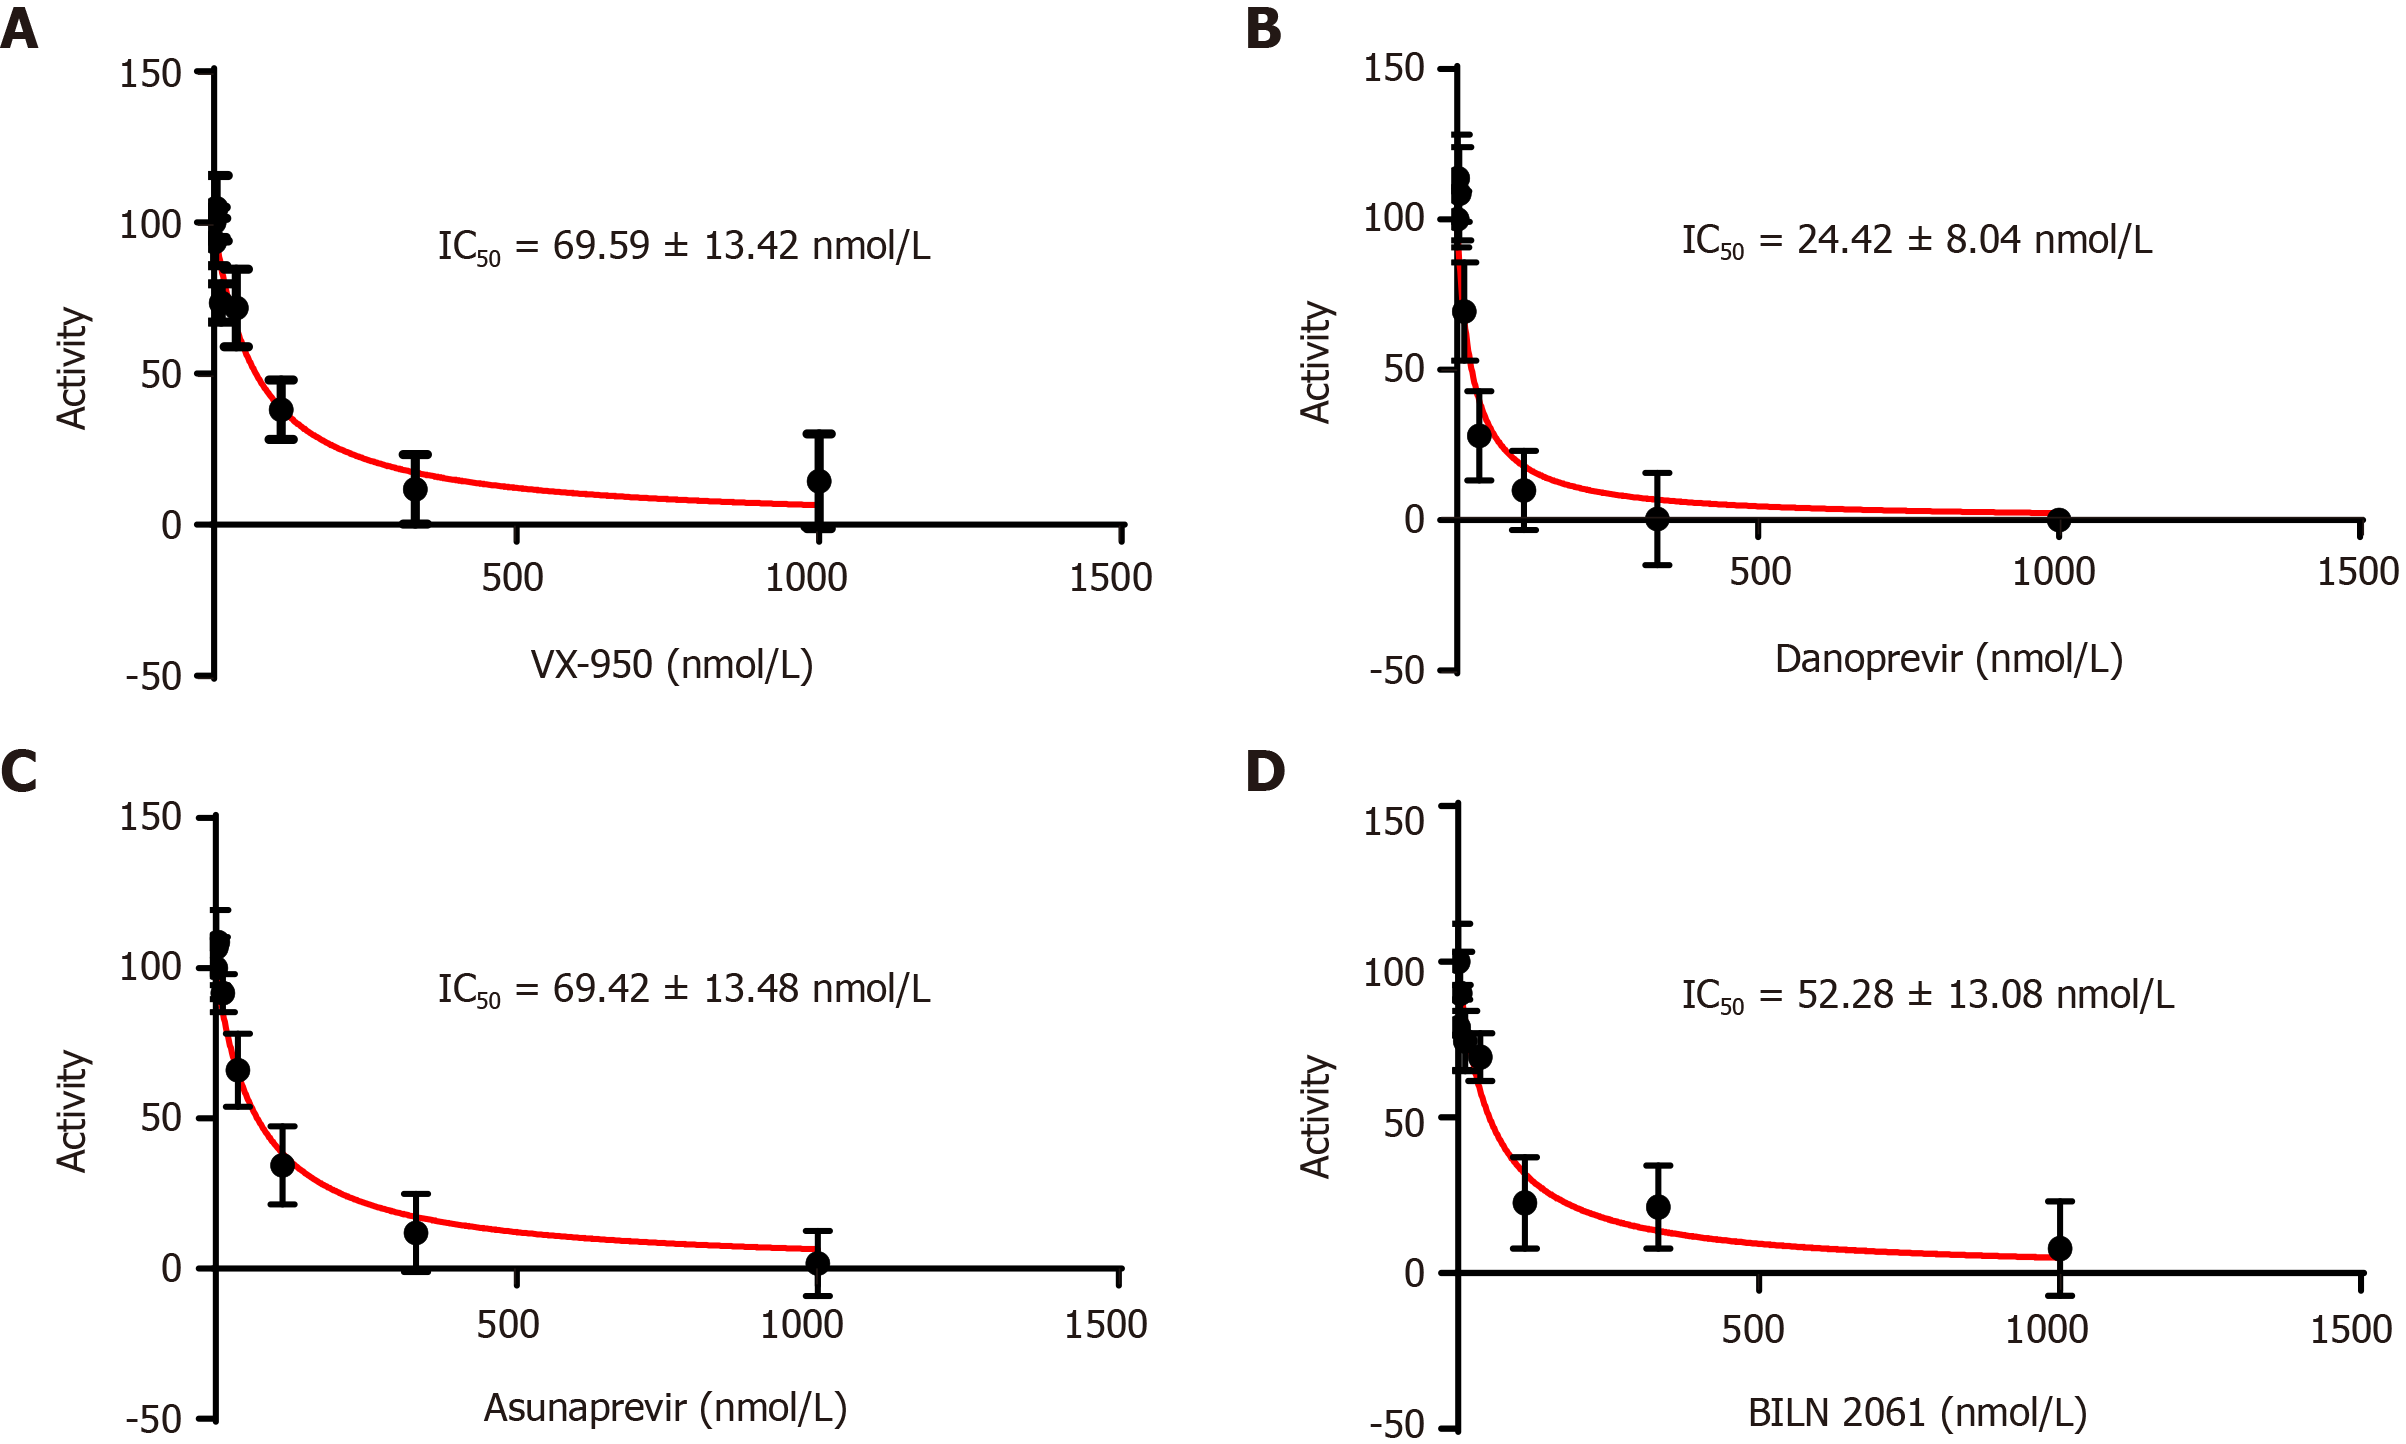
Figure 2 Inhibition of non-structural protein 4a-non-structural protein 3 protease domain by commercial inhibitors.
A: VX-950; B: Danoprevir; C: Asunaprevir; and D: BILN 2061 and determination of inhibition constant (IC50).
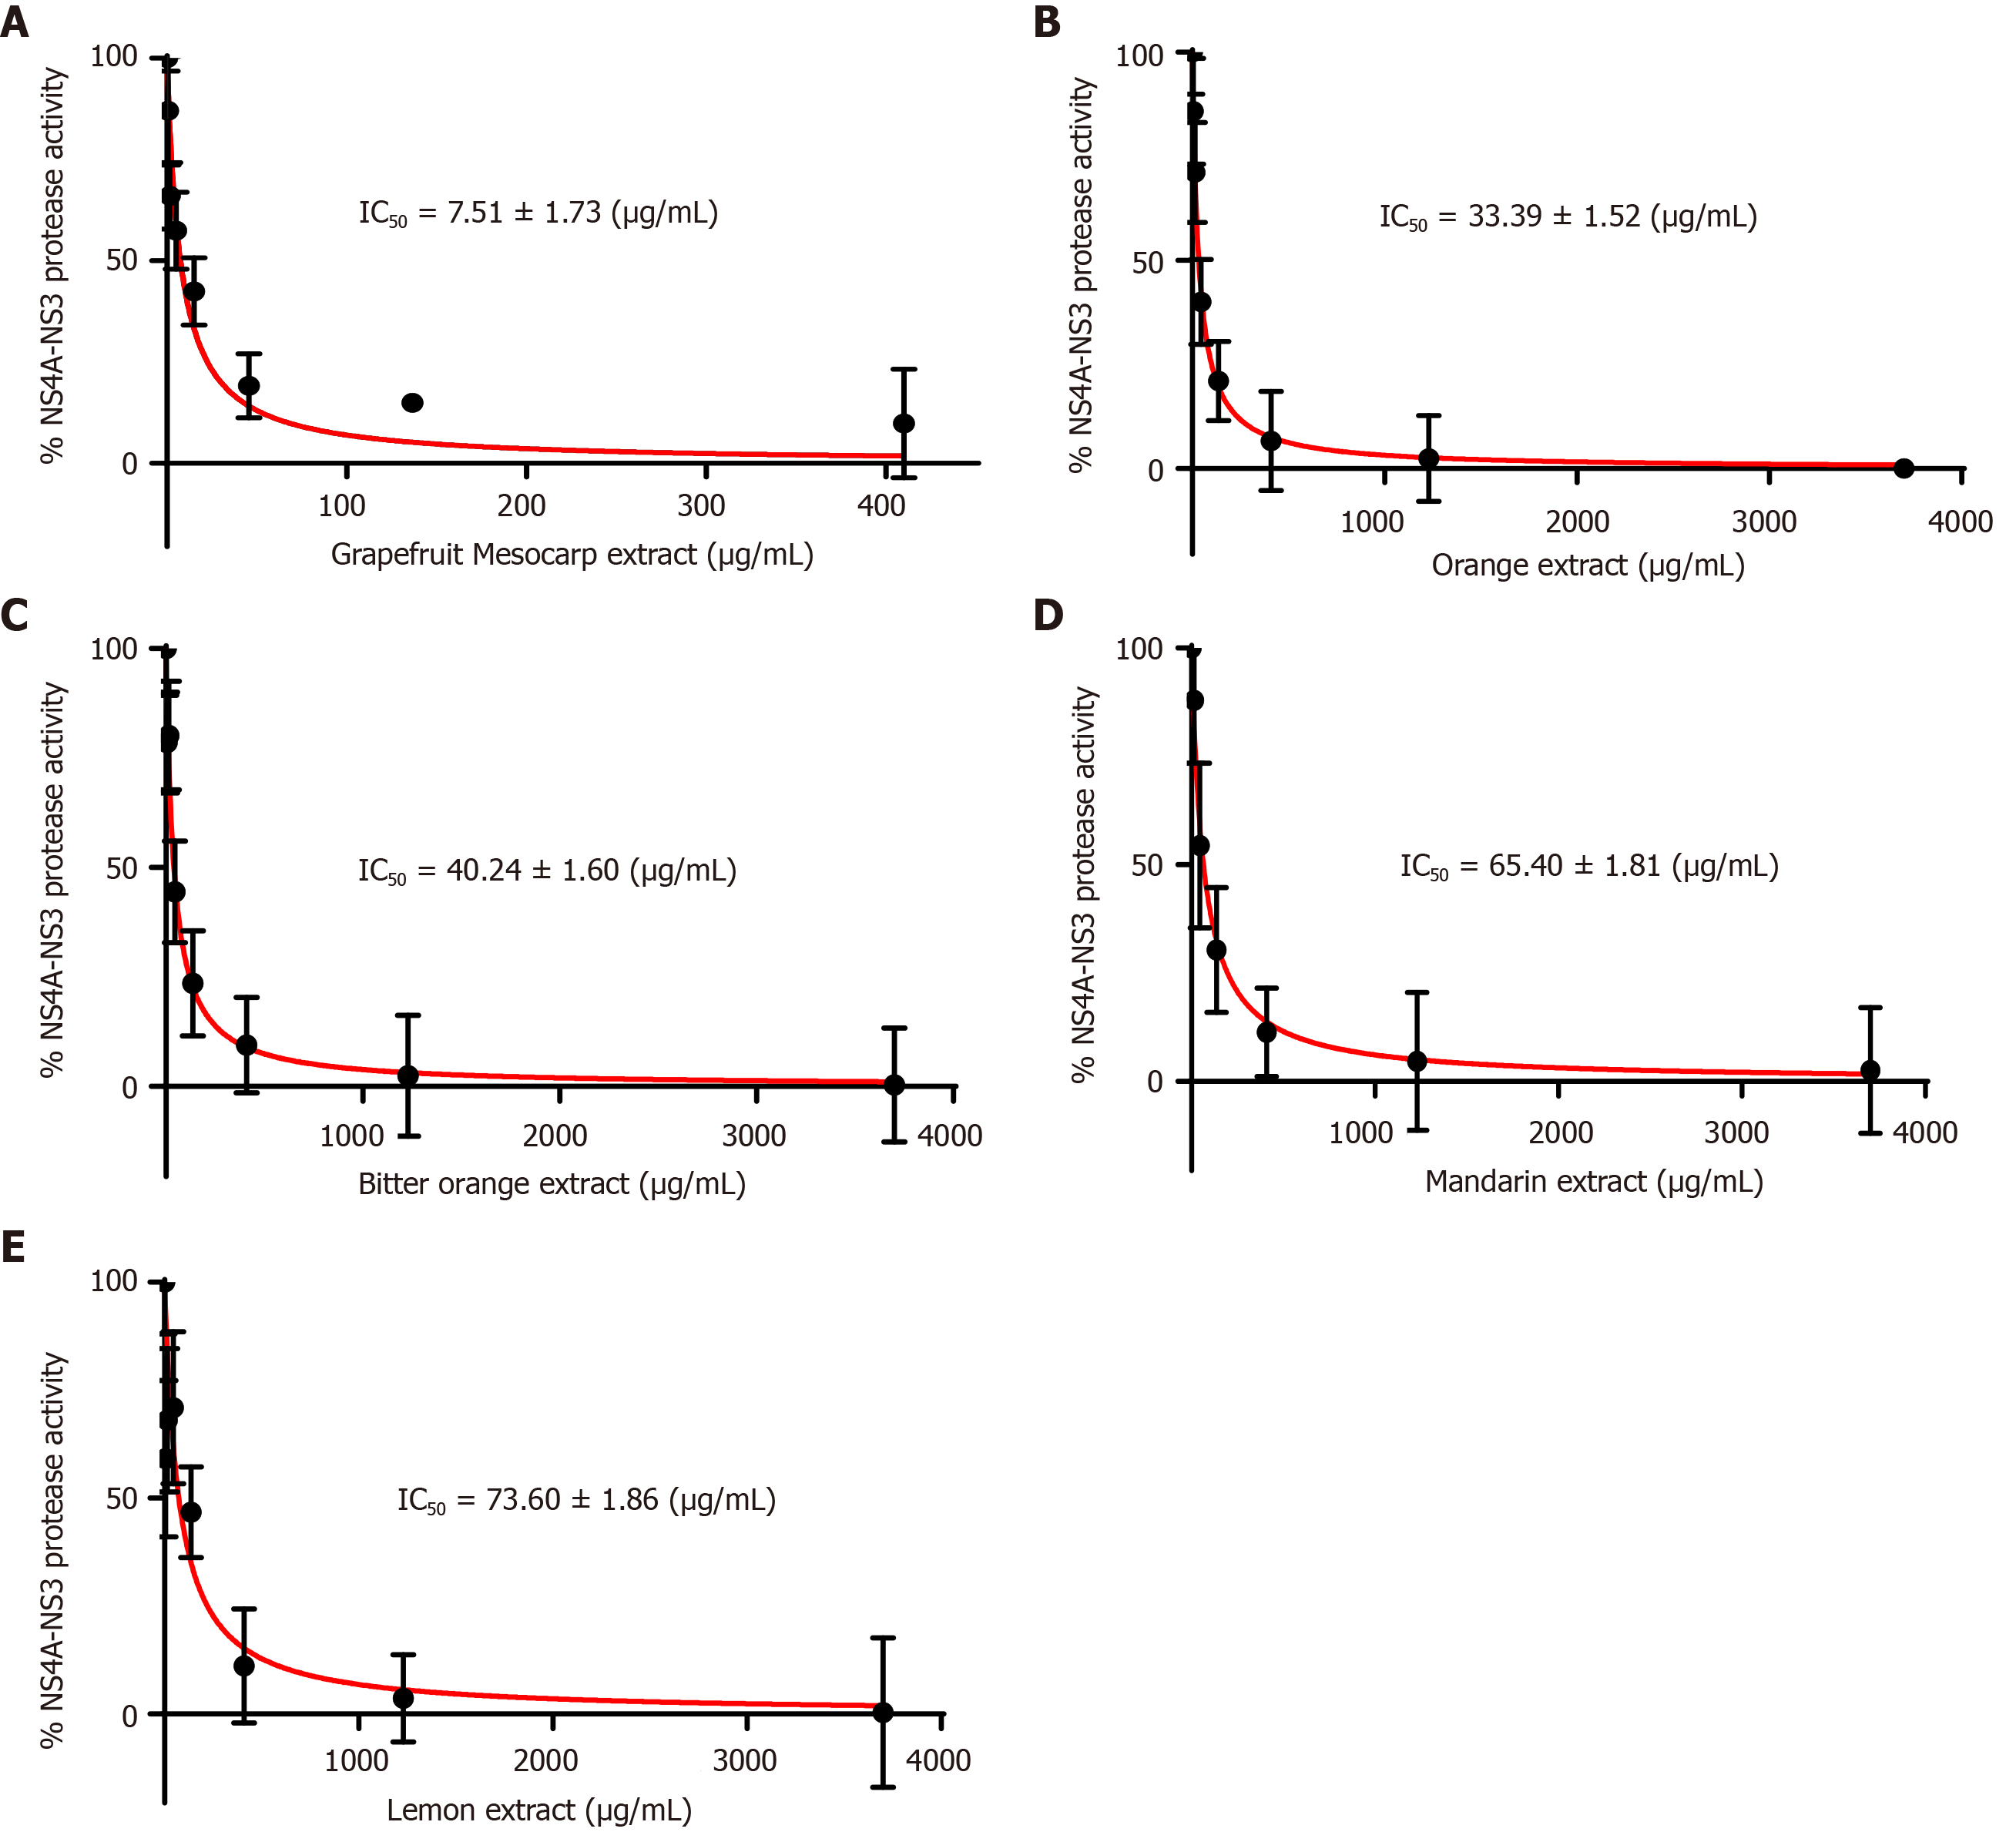
Figure 3 Percentage inhibition pattern and inhibition constant calculation of non-structural protein 4a-non-structural protein 3 protease domain by different citrus fruit extracts inhibitors.
A: Grapefruit mesocarp extract; B: Orange extract; C: Bitter orange extract; D: Mandarin extract; and E: Lemon extract. IC50: Inhibition constant.
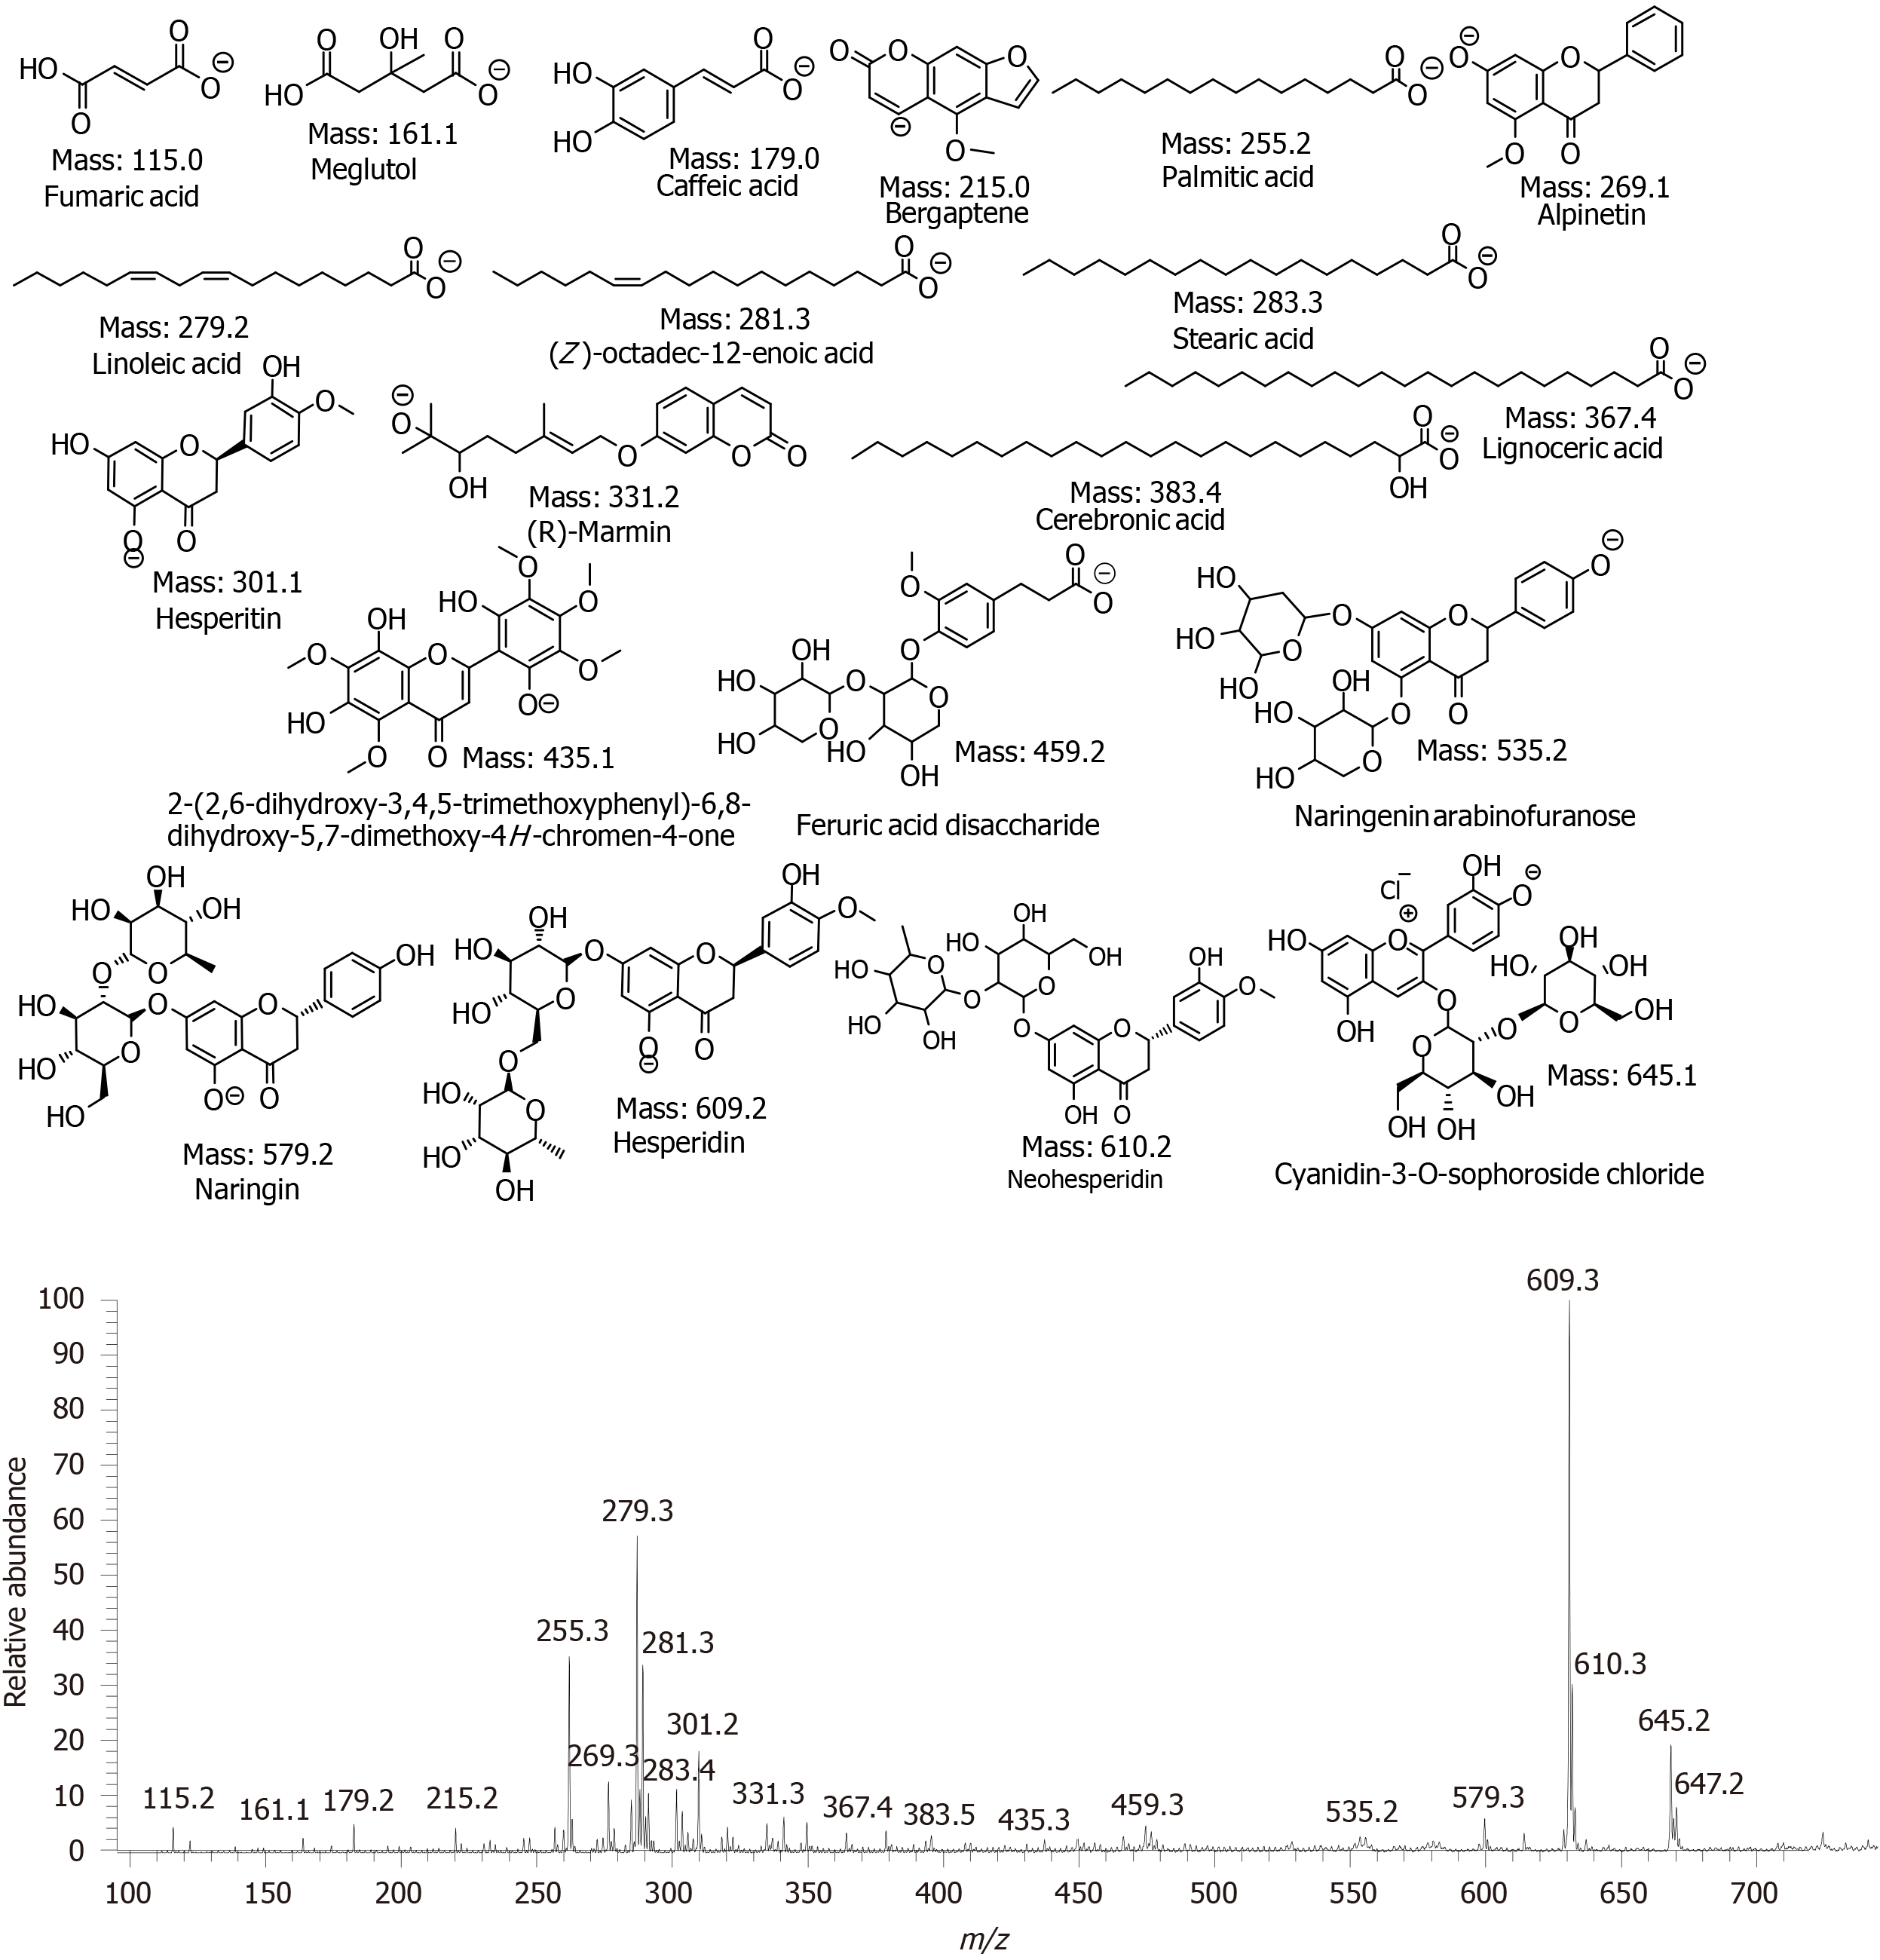
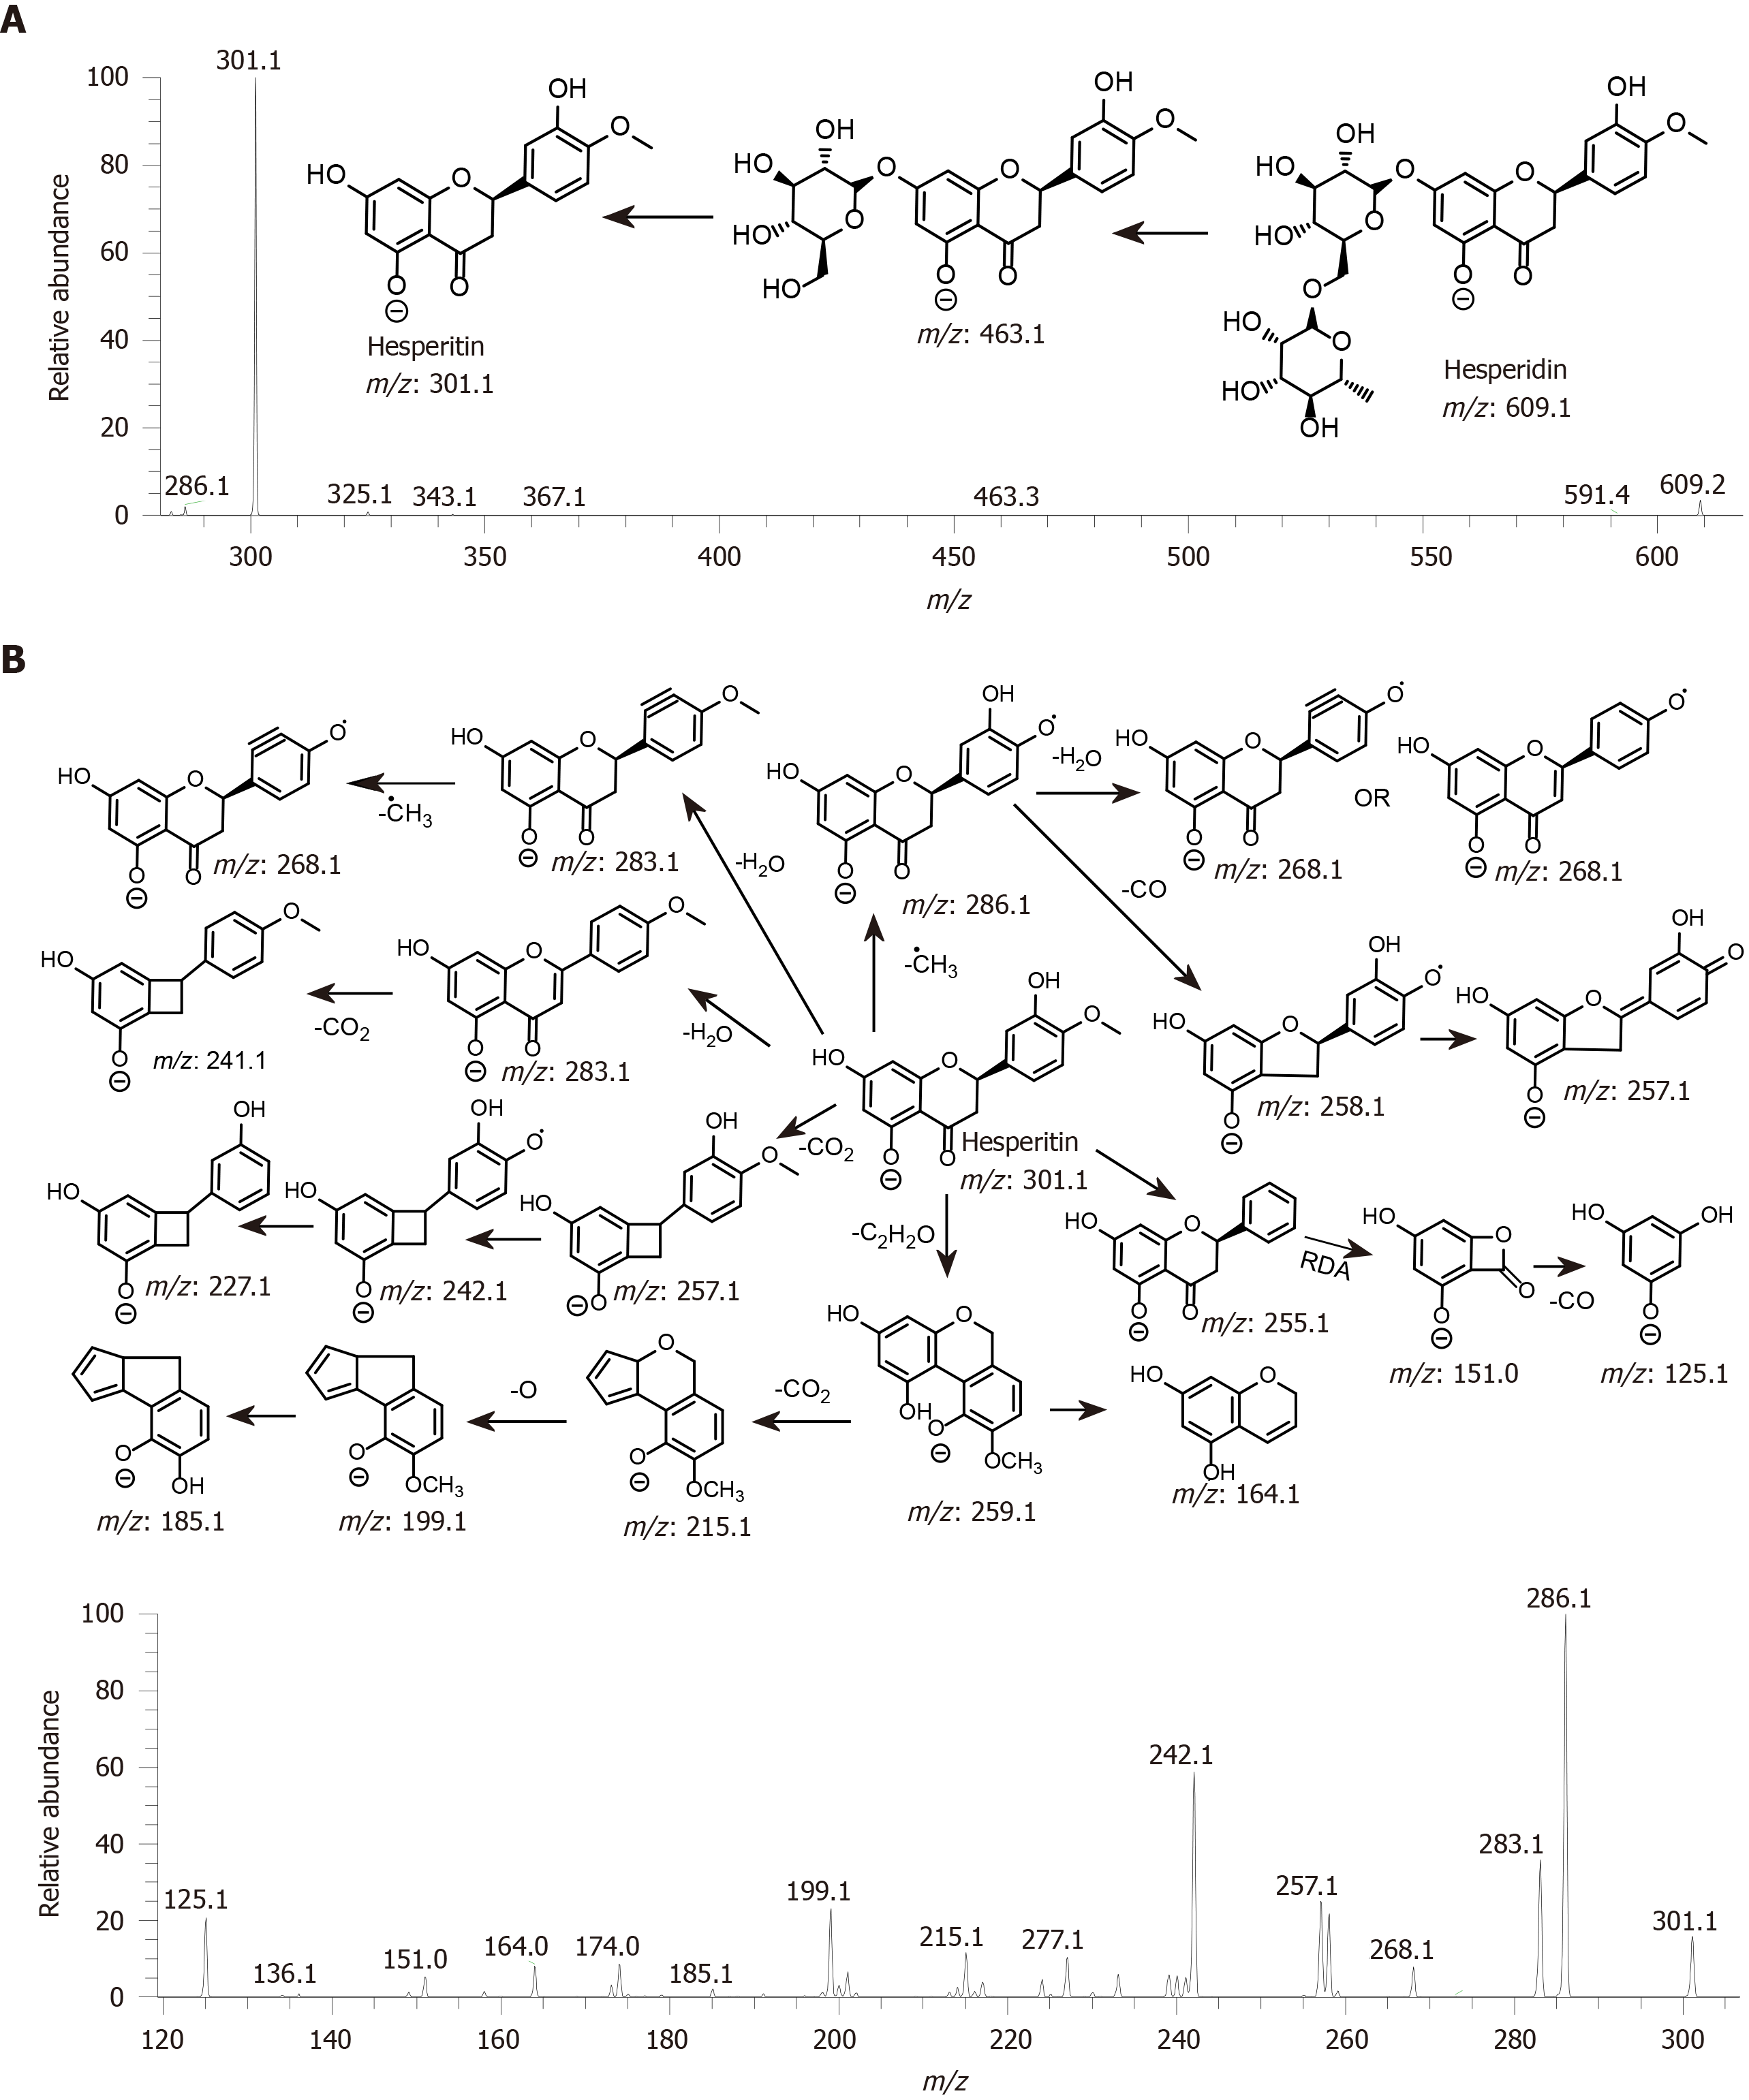
Figure 4 Electrospray ionization mass spectrometry analysis of grapefruit mesocarp extract on negative ion mode.
Figure 5 Proposed fragmentation of hesperidin based on quasi-electrospray ionization -MSn (up to MS3) spectra in negative ion mode.
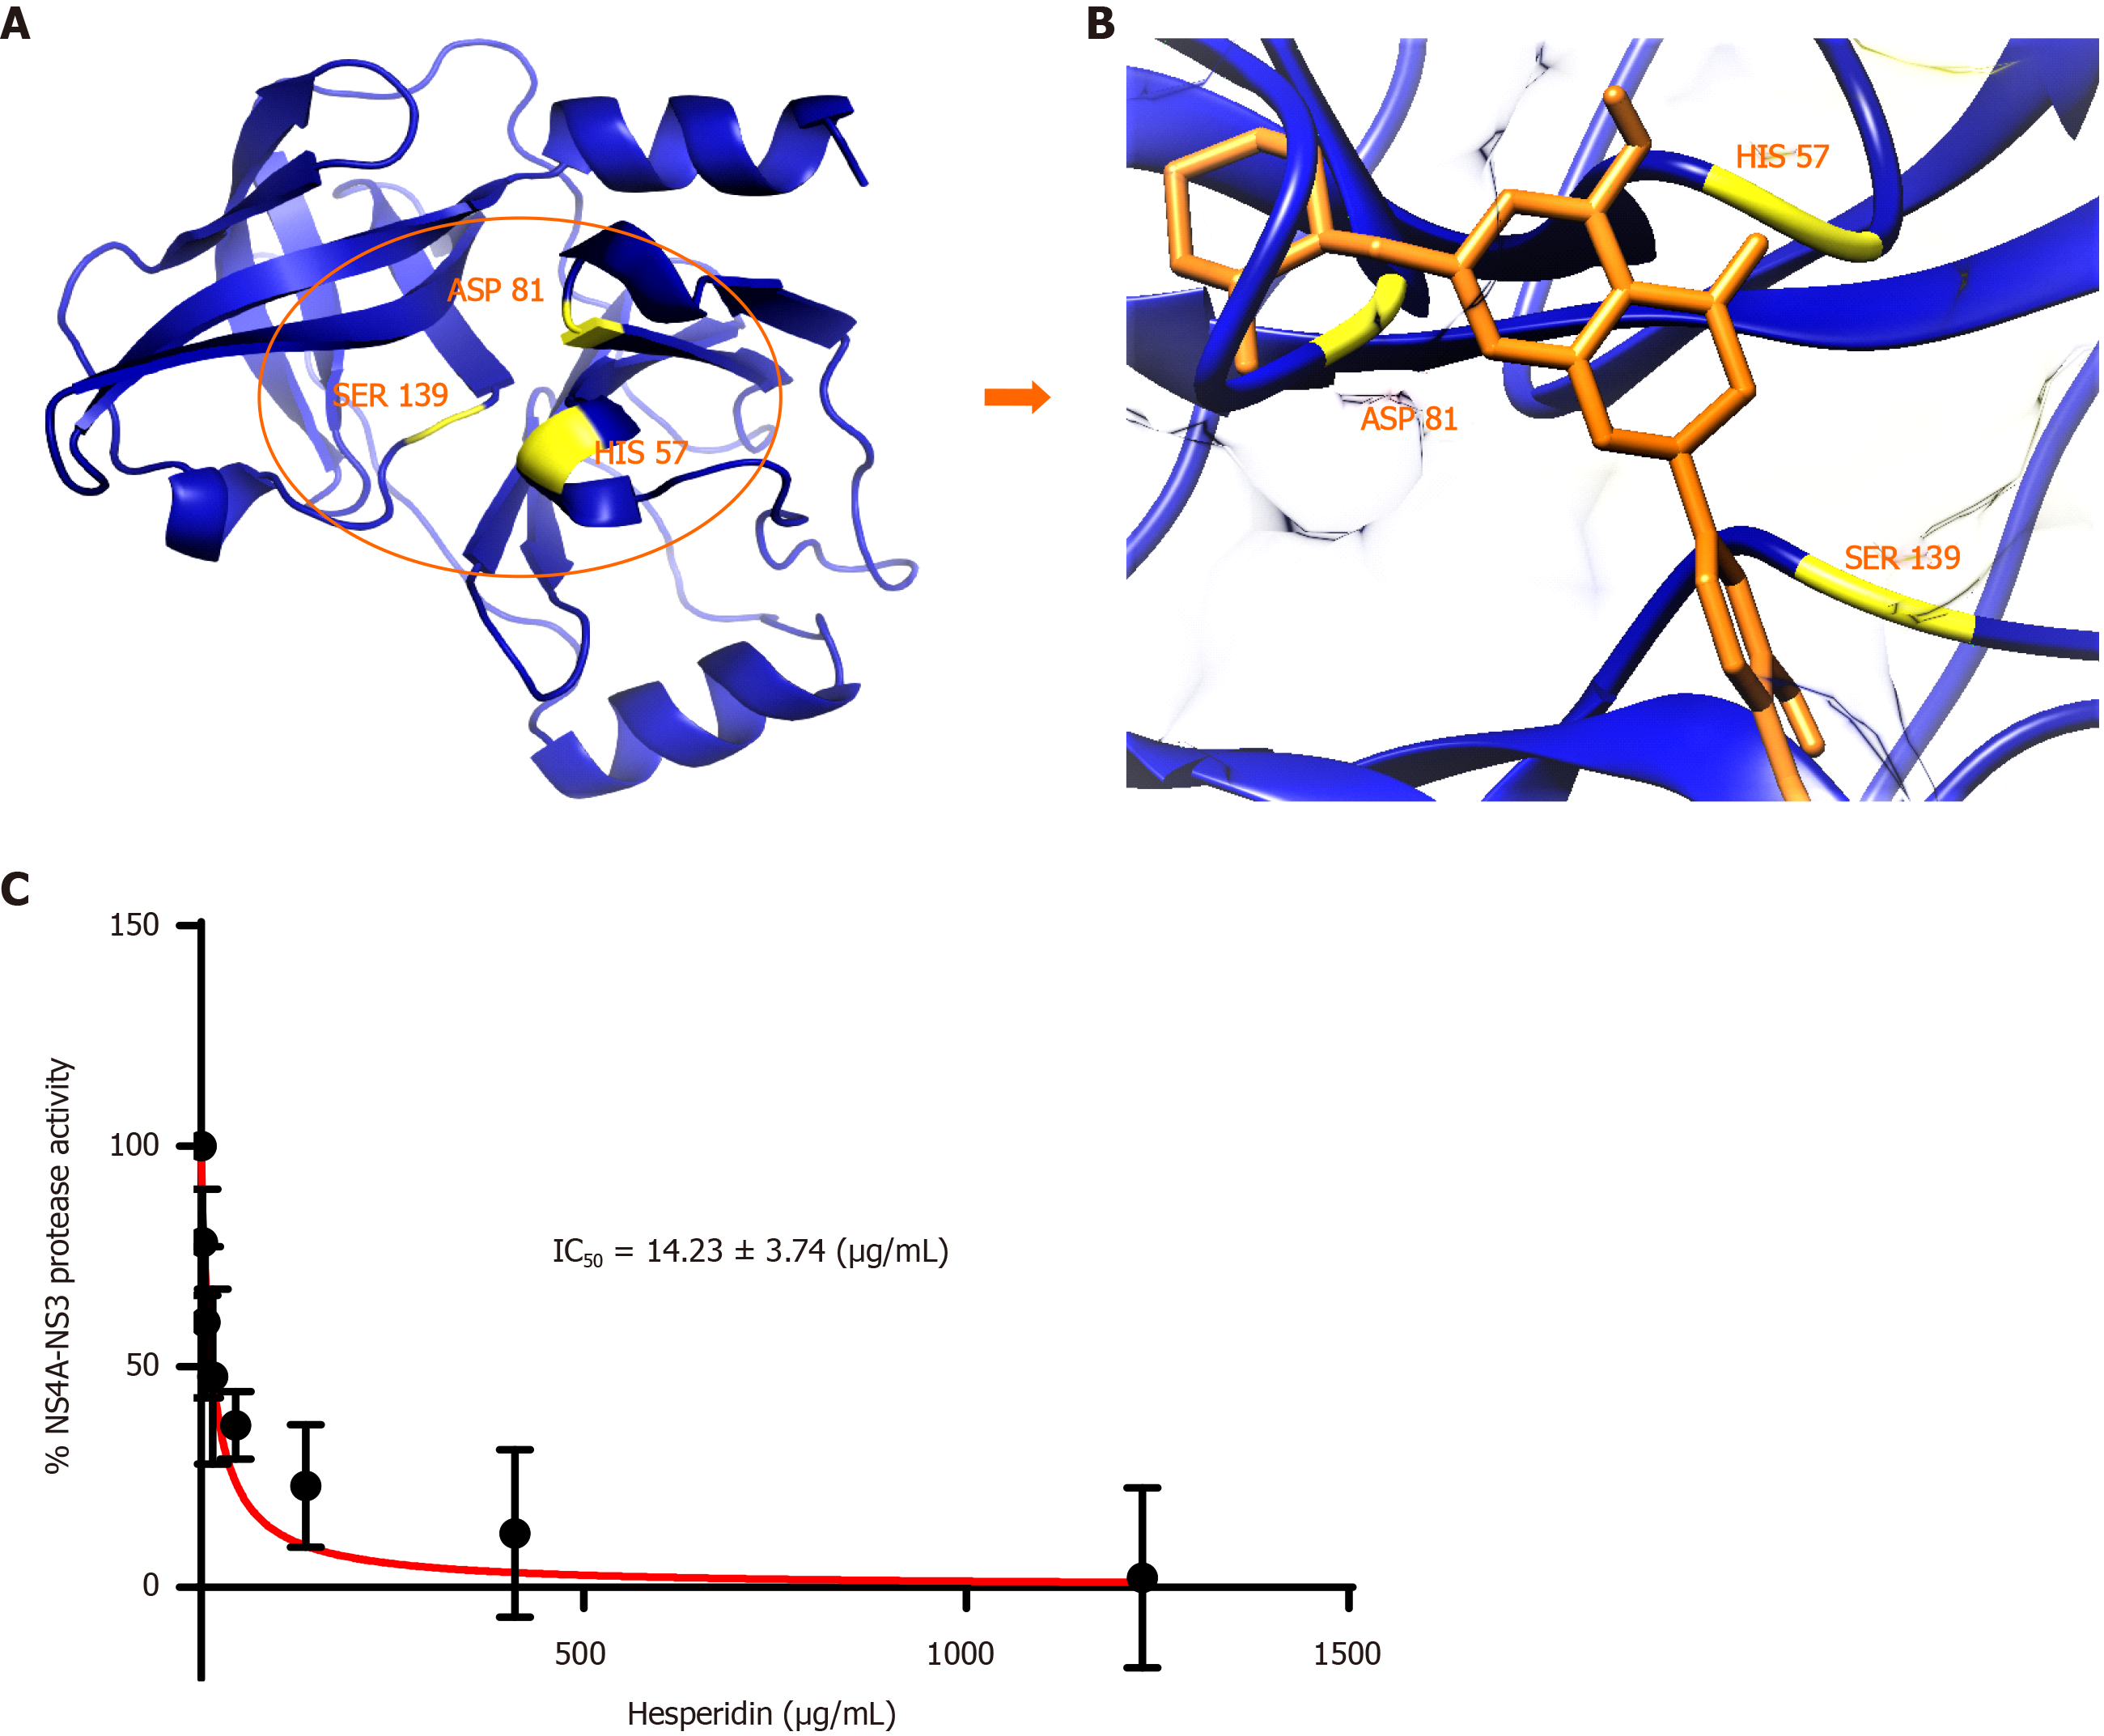
Figure 6 Inhibition studies of hepatitis C virus non-structural protein 4a-non-structural protein 3 protease domain by hesperidin.
A: Hepatitis C virus (HCV) non-structural protein 4a-non-structural protein 3 (NS4A-NS3) protease domain model built by Swiss Model in the blue color cartoon. The active site residues are represented in yellow color for clarification; B: Docking of Hesperidin inside the receptor-binding site of HCV NS4A-NS3 protease domain (HIS 57, ASP 81 and SER 139). Hesperidin is represented in orange color. Blue ribbon represents protease domain of HCV NS3; and C: Inhibition constant (IC50) calculation of HCV NS4A-NS3 protease domain by hesperidin.
- Citation: Khan M, Rauf W, Habib F, Rahman M, Iqbal M. Screening and identification of bioactive compounds from citrus against non-structural protein 3 protease of hepatitis C virus genotype 3a by fluorescence resonance energy transfer assay and mass spectrometry. World J Hepatol 2020; 12(11): 976-992
- URL: https://www.wjgnet.com/1948-5182/full/v12/i11/976.htm
- DOI: https://dx.doi.org/10.4254/wjh.v12.i11.976


