Copyright
©The Author(s) 2020.
World J Gastroenterol. Jun 7, 2020; 26(21): 2821-2830
Published online Jun 7, 2020. doi: 10.3748/wjg.v26.i21.2821
Published online Jun 7, 2020. doi: 10.3748/wjg.v26.i21.2821
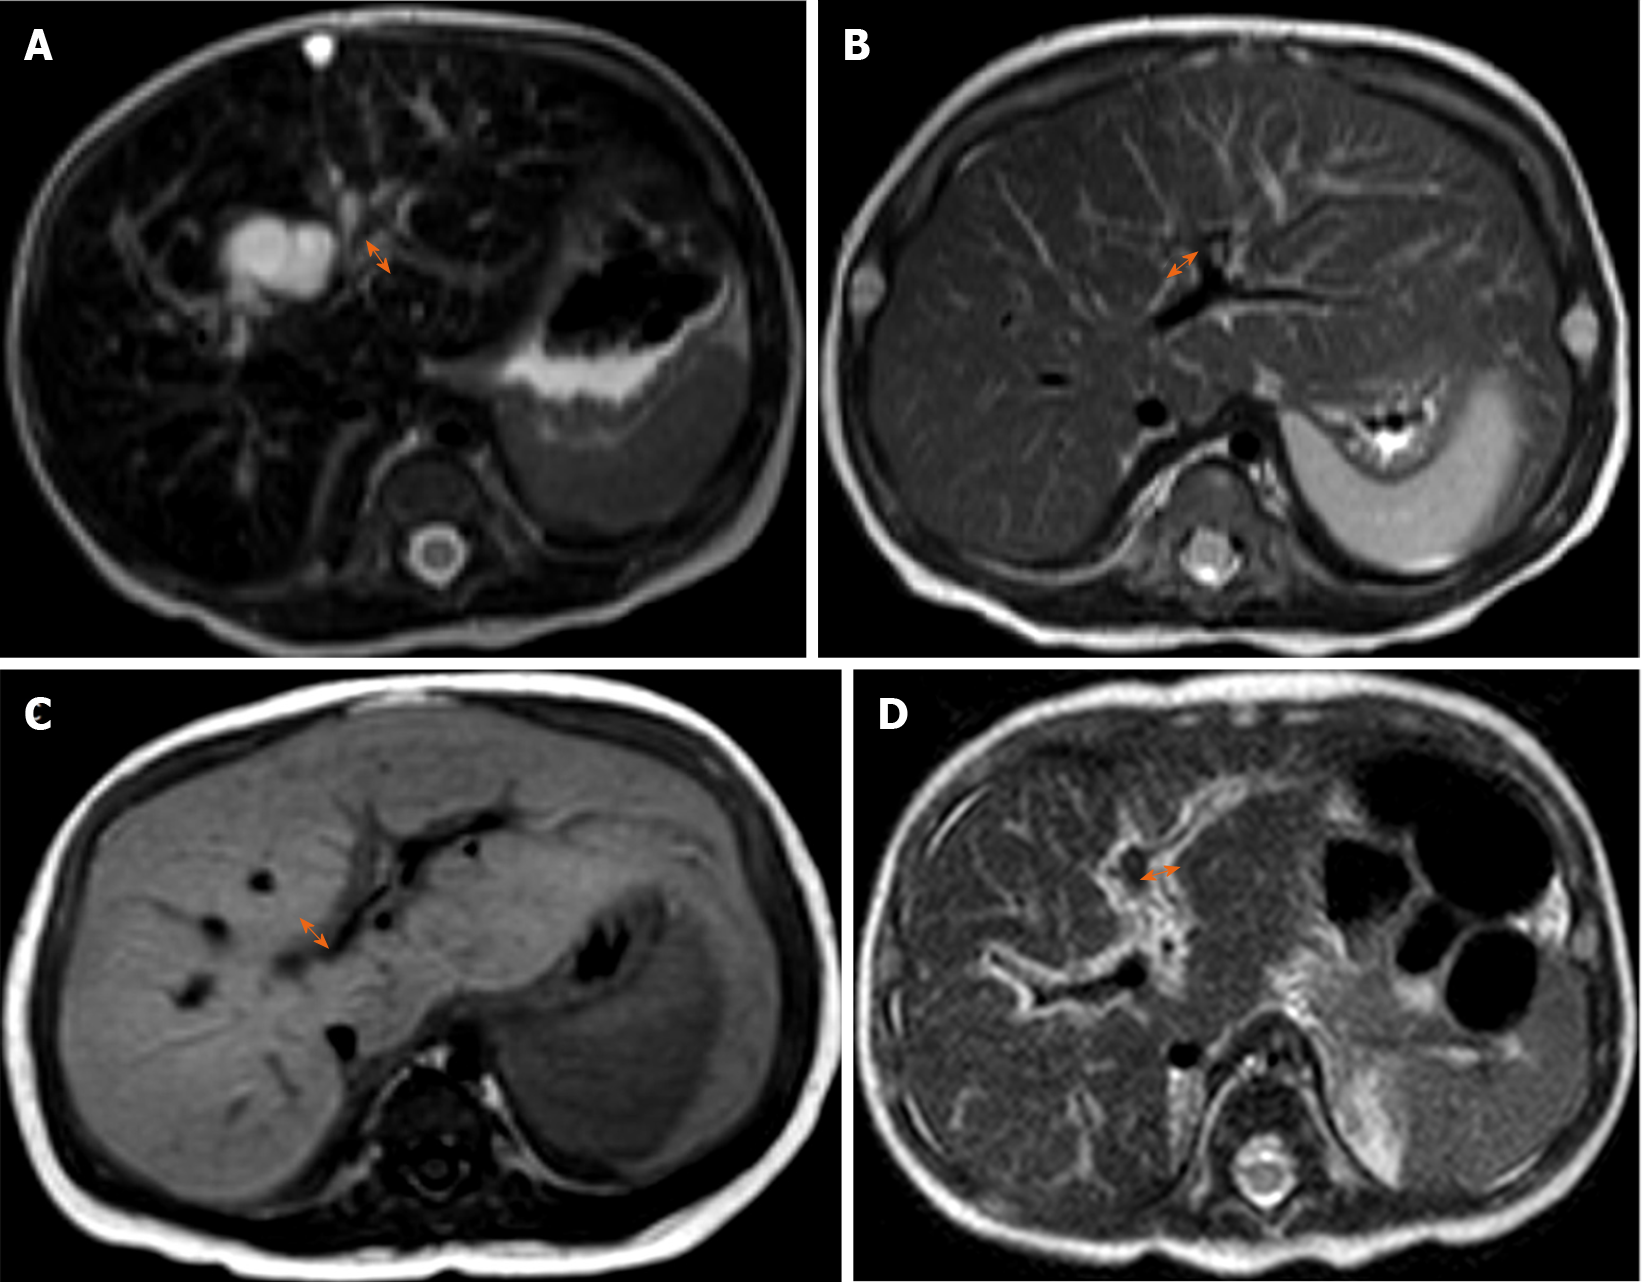
Figure 2 Representative images of periportal thickening for each hepatic fibrosis grade.
The maximal thickness (double arrow in each figure) of periportal signal intensity change was measured. A: 2.7 mm on axial T2-weighted image in a 7-d-old girl with non-biliary atresia (non-biliary atresia, choledochal cyst) and hepatic fibrosis grade 1 (F1); B: 4.2 mm on T2-weighted axial image in a 2-mo-old girl with BA and F2; C: 5.5 mm on T1-weighted axial image in a 3-mo-old girl with biliary atresia and F3; D: 5.4 mm on T2-weighted axial image in a 2-mo-old girl with non-biliary atresia (metabolic disease) and F4.
- Citation: Lee MH, Shin HJ, Yoon H, Han SJ, Koh H, Lee MJ. Periportal thickening on magnetic resonance imaging for hepatic fibrosis in infantile cholestasis. World J Gastroenterol 2020; 26(21): 2821-2830
- URL: https://www.wjgnet.com/1007-9327/full/v26/i21/2821.htm
- DOI: https://dx.doi.org/10.3748/wjg.v26.i21.2821


