Copyright
©The Author(s) 2019.
World J Gastroenterol. Jun 21, 2019; 25(23): 2961-2972
Published online Jun 21, 2019. doi: 10.3748/wjg.v25.i23.2961
Published online Jun 21, 2019. doi: 10.3748/wjg.v25.i23.2961
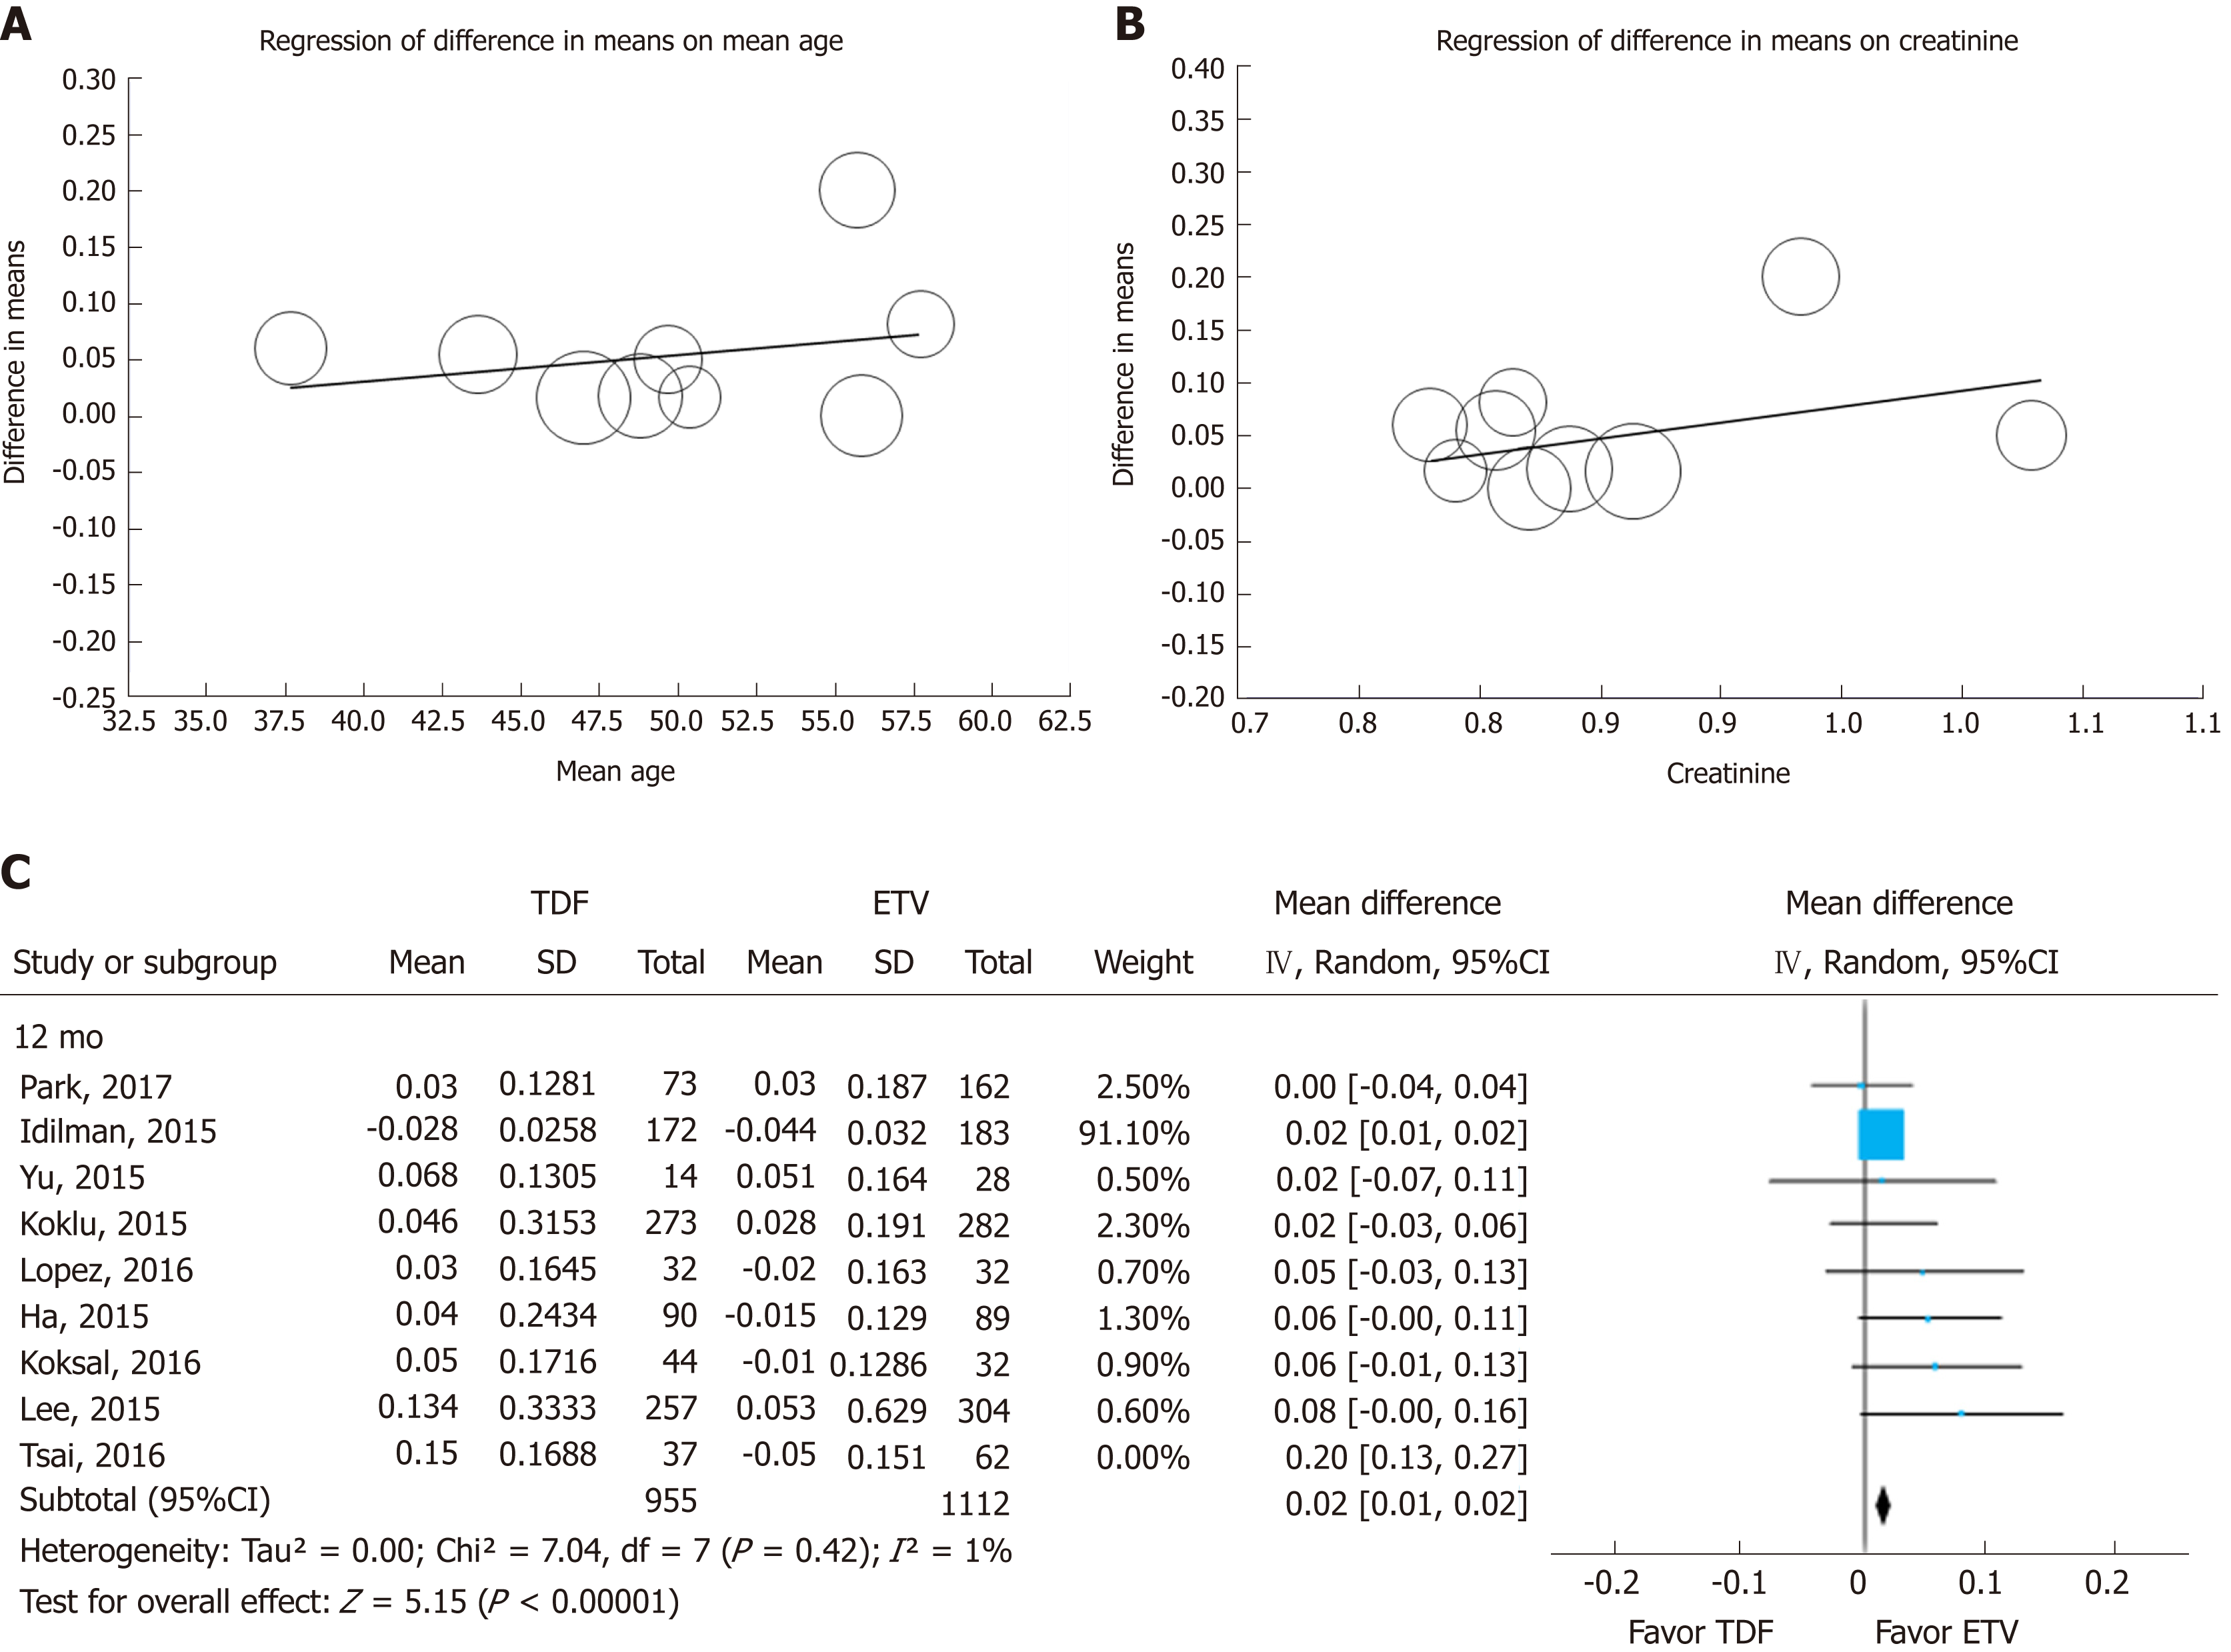
Figure 5 Sensitivity analysis.
Meta-regression of difference in mean age (A) and creatinine (B). The circles on the graph represent included studies; the size of the circle indicates the weight of each study. To check the robustness of this study, we tentatively excluded one heterogeneous study[19] (C). TDF: Tenofovir; ETV: Entecavir; SD: Standard deviation; CI: Confidence interval.
- Citation: Lee HY, Oh H, Park CH, Yeo YH, Nguyen MH, Jun DW. Comparison of renal safety of tenofovir and entecavir in patients with chronic hepatitis B: Systematic review with meta-analysis. World J Gastroenterol 2019; 25(23): 2961-2972
- URL: https://www.wjgnet.com/1007-9327/full/v25/i23/2961.htm
- DOI: https://dx.doi.org/10.3748/wjg.v25.i23.2961


