Copyright
©The Author(s) 2019.
World J Gastroenterol. Mar 14, 2019; 25(10): 1266-1277
Published online Mar 14, 2019. doi: 10.3748/wjg.v25.i10.1266
Published online Mar 14, 2019. doi: 10.3748/wjg.v25.i10.1266
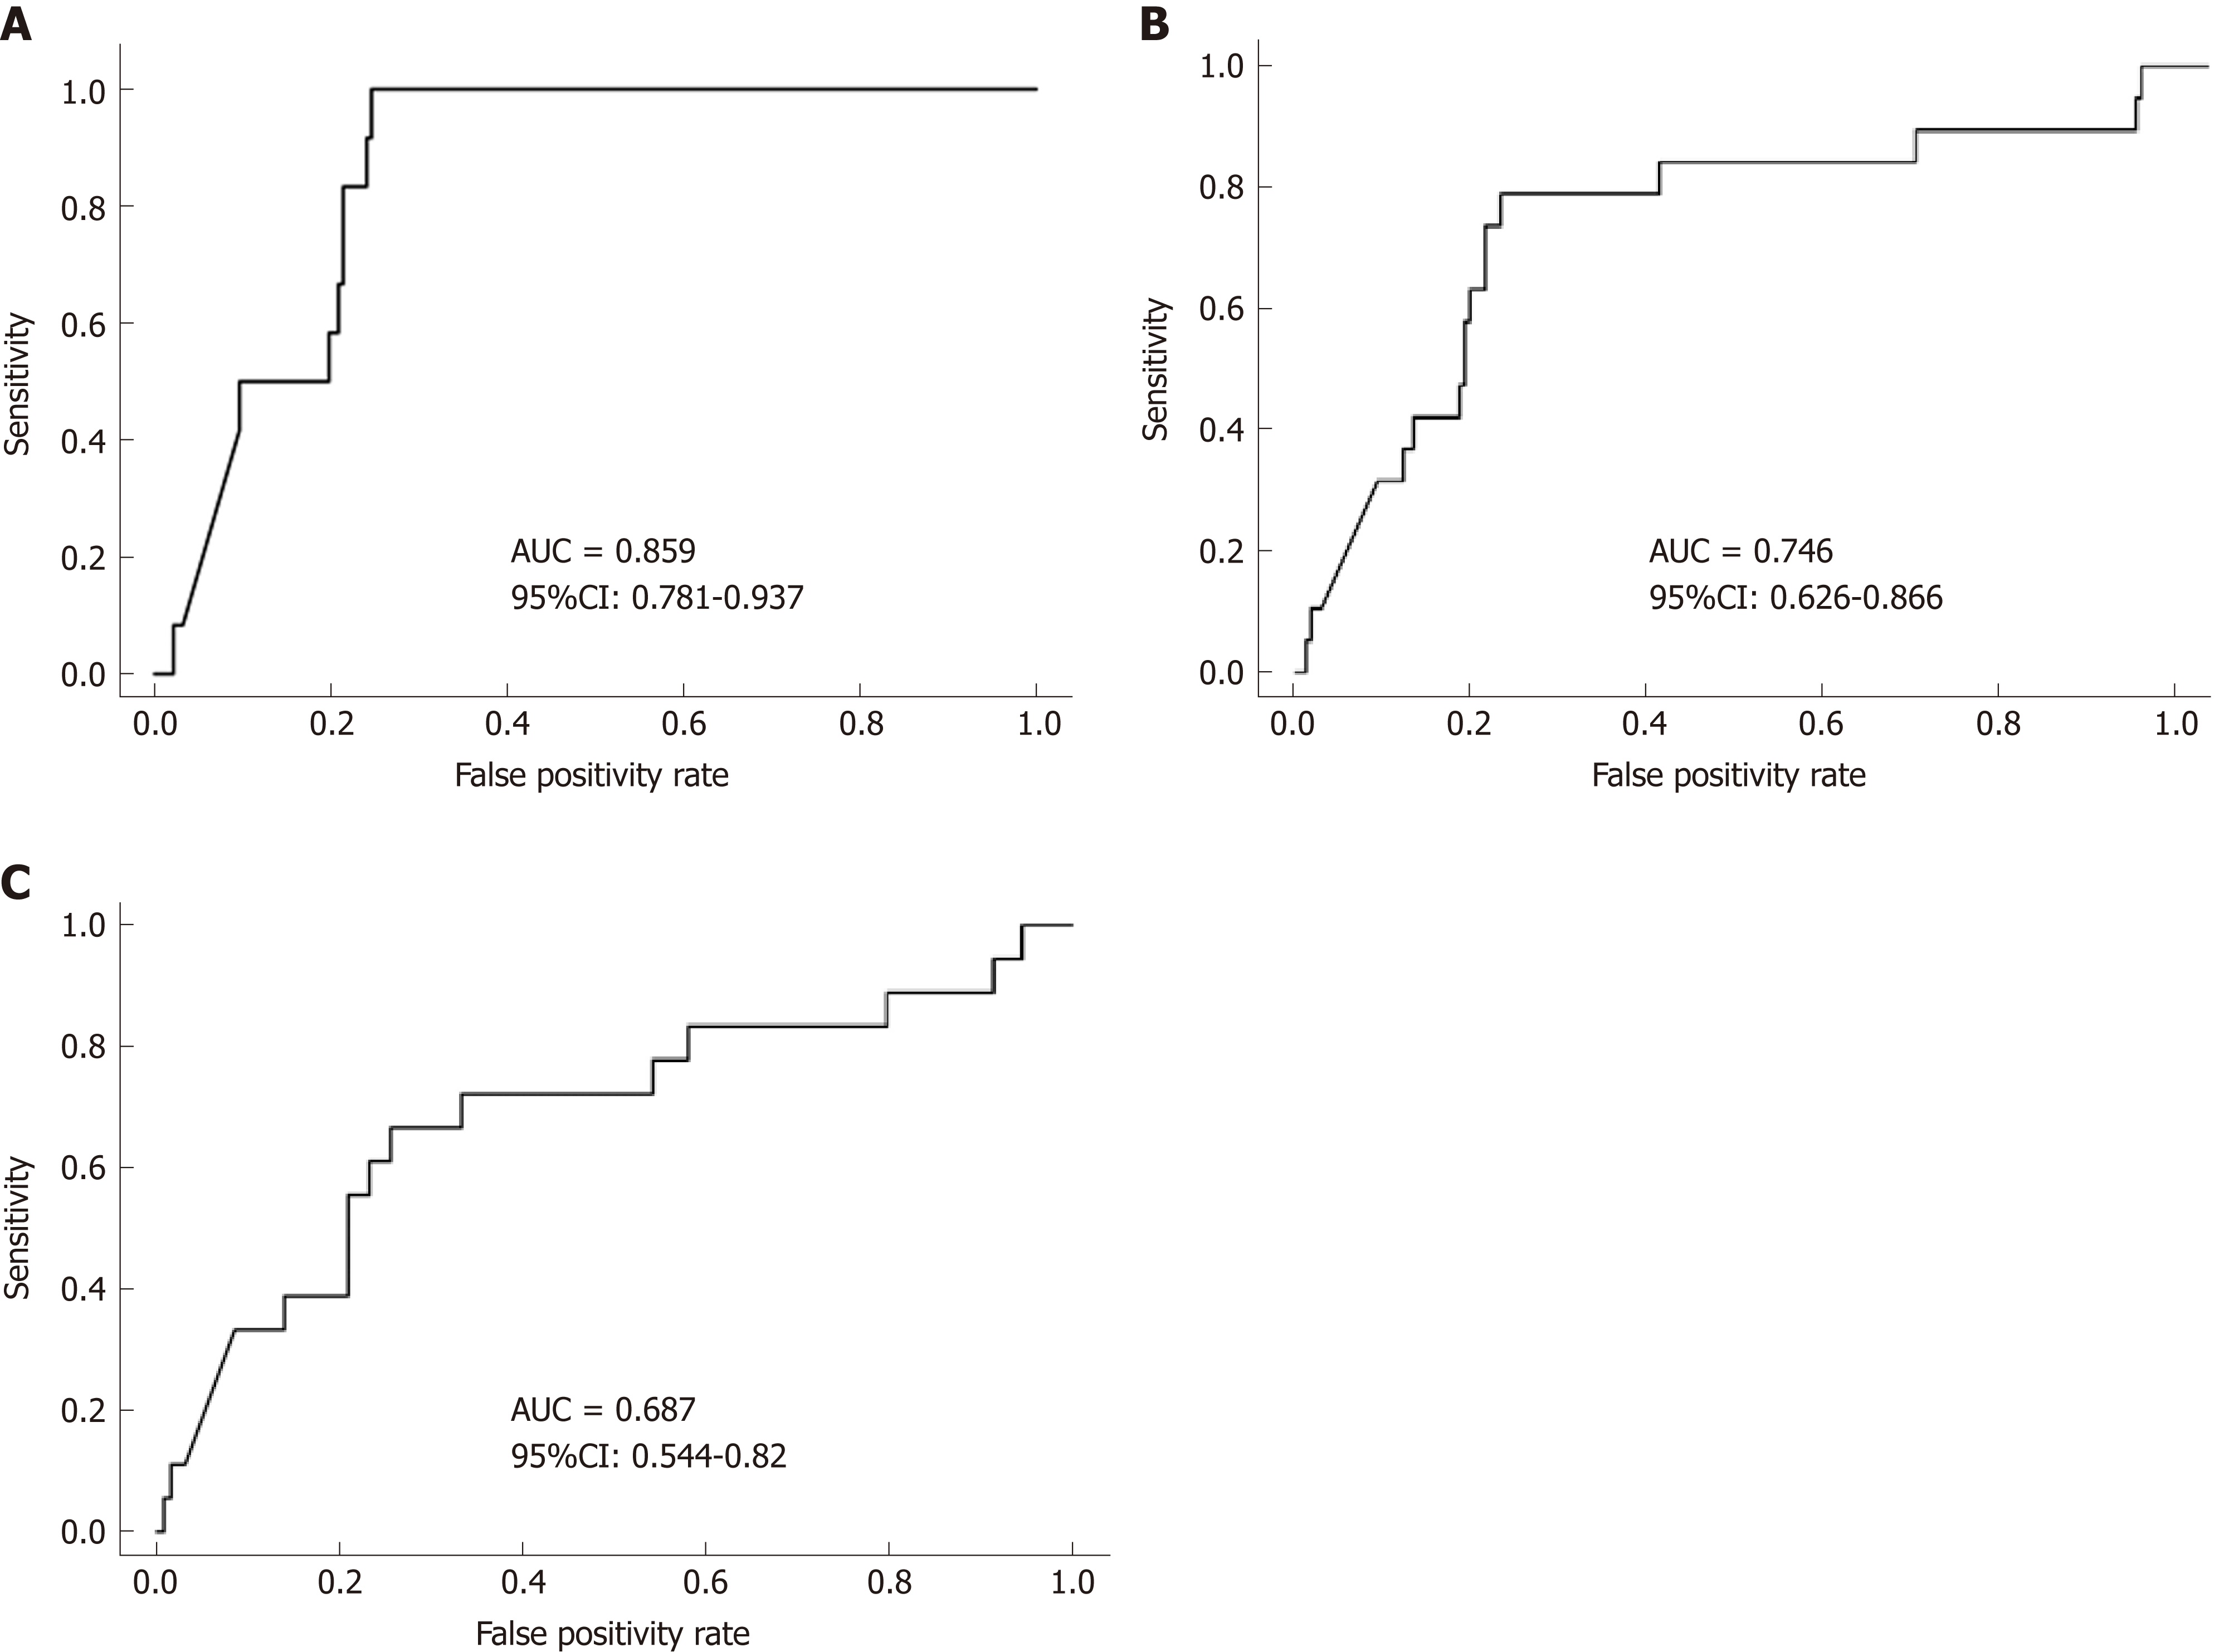
Figure 4 Receiver operator characteristic curve analysis for predicting clinical disease relapse.
A: 3-mo; B: 6-mo; C: 12-mo. FC levels at the 3-mo visit more accurately predict clinical disease relapse than at 6-mo and 12-mo post baseline (univariate analysis). FC: Fecal calprotectin; AUC: Area under the curve; CI: Confidence interval.
- Citation: Foster AJ, Smyth M, Lakhani A, Jung B, Brant RF, Jacobson K. Consecutive fecal calprotectin measurements for predicting relapse in pediatric Crohn’s disease patients. World J Gastroenterol 2019; 25(10): 1266-1277
- URL: https://www.wjgnet.com/1007-9327/full/v25/i10/1266.htm
- DOI: https://dx.doi.org/10.3748/wjg.v25.i10.1266


