Copyright
©The Author(s) 2018.
World J Gastroenterol. Aug 7, 2018; 24(29): 3260-3272
Published online Aug 7, 2018. doi: 10.3748/wjg.v24.i29.3260
Published online Aug 7, 2018. doi: 10.3748/wjg.v24.i29.3260
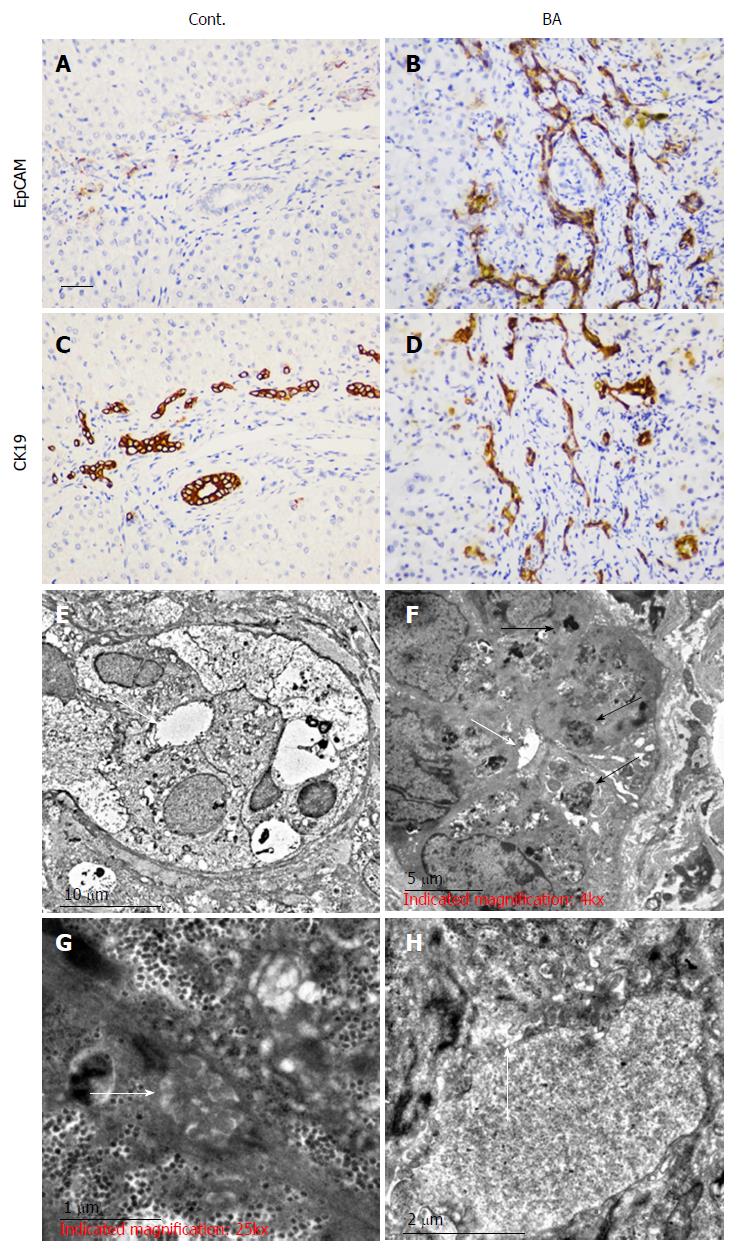
Figure 1 Expression levels of EpCAM and CK19 in neonatal liver biopsies and electron microscopy analysis of hepatic ultrastructure.
To test the biliary epithelial marker expression levels, immunohistochemical staining was performed on disease control samples (Cont., choledochal cyst, A and C) and biliary atresia patient samples (BA, B and D). For the colocalization study of EpCAM and CK19, adjacent tissue sections were used. The scale bar is shown as 50 μm. For the EM analysis, liver tissues from the Cont. (E and F) and BA patients (G and H) were sectioned at 50-70 nm and stained with uranyl acetate and lead citrate. Photographs of the bile capillary (E and G) and microvilli (F and H) were captured and presented. The scale bar is also shown in the photographs. n = 5 each for the CC and BA groups.
- Citation: Zhang RZ, Zeng XH, Lin ZF, Ming-Fu, Tong YL, Lui VC, Tam PK, Lamb JR, Xia HM, Chen Y. Downregulation of Hes1 expression in experimental biliary atresia and its effects on bile duct structure. World J Gastroenterol 2018; 24(29): 3260-3272
- URL: https://www.wjgnet.com/1007-9327/full/v24/i29/3260.htm
- DOI: https://dx.doi.org/10.3748/wjg.v24.i29.3260


