Published online Jan 14, 2018. doi: 10.3748/wjg.v24.i2.226
Peer-review started: October 27, 2017
First decision: November 21, 2017
Revised: December 5, 2017
Accepted: December 13, 2017
Article in press: December 13, 2017
Published online: January 14, 2018
To investigate the mechanism by which hepatitis C virus (HCV) core protein-induced miR-93-5p up-regulation regulates the interferon (IFN) signaling pathway.
HCV-1b core protein was exogenously expressed in Huh7 cells using pcDNA3.1 (+) vector. The expression of miR-93-5p and interferon receptor 1 (IFNAR1) was measured using quantitative reverse transcription-polymerase chain reaction and Western blot. The protein expression and phosphorylation level of STAT1 were evaluated by Western blot. The overexpression and silencing of miR-93-5p and IFNAR1 were performed using miR-93-5p agomir and antagomir, and pcDNA3.1-IFNAR1 and IFNAR1 siRNA, respectively. Luciferase assay was used to identify whether IFNAR1 is a target of miR-93-5p. Cellular experiments were also conducted.
Serum miR-93-5p level was increased in patients with HCV-1b infection and decreased to normal level after HCV-1b clearance, but persistently increased in those with pegylated interferon-α resistance, compared with healthy subjects. Serum miR-93-5p expression had an AUC value of 0.8359 in distinguishing patients with pegylated interferon-α resistance from those with pegylated interferon-α sensitivity. HCV-1b core protein increased miR-93-5p expression and induced inactivation of the IFN signaling pathway in Huh7 cells. Furthermore, IFNAR1 was identified as a direct target of miR-93-5p, and IFNAR1 restore could rescue miR-93-5p-reduced STAT1 phosphorylation, suggesting that the miR-93-5p-IFNAR1 axis regulates the IFN signaling pathway.
HCV-1b core protein-induced miR-93-5p up-regulation inhibits the IFN signaling pathway by directly targeting IFNAR1, and the miR-93-5p-IFNAR1 axis regulates STAT1 phosphorylation. This axis may be a potential therapeutic target for HCV-1b infection.
Core tip: Hepatitis C virus-1b core protein increases miR-93-5p expression and induces inactivation of the IFN signaling pathway. MiR-93-5p expression is involved in pegylated interferon-α resistance and directly targets interferon receptor 1 (IFNAR1). The miR-93-5p-IFNAR1 axis regulates STAT1 phosphorylation.
- Citation: He CL, Liu M, Tan ZX, Hu YJ, Zhang QY, Kuang XM, Kong WL, Mao Q. Hepatitis C virus core protein-induced miR-93-5p up-regulation inhibits interferon signaling pathway by targeting IFNAR1. World J Gastroenterol 2018; 24(2): 226-236
- URL: https://www.wjgnet.com/1007-9327/full/v24/i2/226.htm
- DOI: https://dx.doi.org/10.3748/wjg.v24.i2.226
Hepatitis C virus (HCV) is a positive-sense single-stranded RNA virus that causes hepatitis, jaundice, and even fulminant hepatic failure at the beginning of infection, but in the majority of persons, the persistent infection with HCV causes cirrhosis and hepatocellular carcinoma (HCC)[1]. It is estimated that chronic hepatitis C impacts approximately 350 million people and constitutes a significant health burden worldwide[2,3]. In the past two decades, interferon (IFN) has served as the mainstay drug for HCV treatment, and its effect was improved by the addition of ribavirin and then by linking polyethylene glycol to the interferon molecule[4-6]. However, the outcome of IFN-based therapies depends mainly on the patients’ responsiveness and the HCV genotype, especially HCV genotype 1 which has shown no sufficient response to pegylated interferon-α (IFNα)[7]. The core protein is an important component of HCV and plays a crucial role in HCV infection and pegylated IFNα resistance, but the mechanism underlying HCV core protein-induced pegylated IFNα resistance remains unclear.
MicroRNAs (miRNAs) are a class of single non-coding RNAs with a length of approximately 20 nt, which are involved in the regulation of HCV infection[8]. Several studies indicated that the expression of multiple miRNAs, such as miR-122, miR-1, miR-30, and miR-146a, was regulated by IFN in inhibiting HCV replication[9,10]. Kim et al[11] showed that HCV core protein promoted miR-122 destabilization in Huh7 cells, suggesting that miRNA expression was also regulated by HCV core protein. Furthermore, miRNAs can also inhibit HCV replication and infectivity, such as let-7 family miRNAs[12], suggesting that miRNAs may serve as targets for HCV therapy. The aberrant expression of miRNAs during HCV infection is involved in HCV-associated host pathways[13]. Recent studies have shown that miR-93-5p was overexpressed in HCV-associated HCC and promoted HCC progression[14,15]. However, whether miR-93-5p plays important roles in HCV core protein-associated IFN signaling pathway remains largely unclear.
In the present study, we demonstrated that serum miR-93-5p expression was higher in HCV-1b-infected patients with pegylated IFNα resistance compared with those with pegylated IFNα sensitivity. HCV-1b core protein increased miR-93-5p expression and inhibited the IFN signaling pathway in Huh7 cells. Interferon receptor 1 (IFNAR1) was identified as a direct target of miR-93-5p, and the miR-93-5p-INFAR1 axis regulated the IFN signaling pathway.
We enrolled 84 patients who had been identified to be infected with HCV-1b and 84 healthy subjects at Southwest Hospital, Third Military Medical University from July 2012 to June 2016. These patients were divided into two groups, one of which had pegylated IFNα resistance and the other had pegylated IFNα sensitivity. The clinical characteristics of individuals are described in Table 1. The collection of all samples obtained the consent from subjects according to the protocols approved by the Ethics Review Board of Southwest Hospital Institutional Review Board. Serum was isolated from blood samples within 2 h after collection according to the following steps: (1) centrifugation at 1500 rpm for 10 min, followed by transferring to new tubes; and (2) centrifugation at 12000 rpm for 2 min. These steps can prevent contamination by the cellular nucleic acids[16].
| Variable | High expression of miR-93-5p | Low expression of miR-93-5p | P value |
| Gender | 0.382 | ||
| Male | 25 | 20 | |
| Female | 17 | 22 | |
| Age | 0.189 | ||
| Median | |||
| >44 | 19 | 26 | |
| ≤44 | 23 | 16 | |
| HCV-1b treatment | 0.001 | ||
| Resistance | 25 | 9 | |
| Sensitivity | 17 | 33 |
Human hepatocellular carcinoma cell line Huh7 was purchased from ATCC, and cultured in high glucose Dulbecco’s modified Eagle’s medium (Hyclone, United States) supplemented with 10% fetal bovine serum (Gibco, United States) in a humidified incubator with 5% CO2 at 37 °C.
Total RNA was isolated from cells and serum using TRI reagent (Invitrogen, Carlsbad, CA, United States) and TRIzol LS reagent (Invitrogen), respectively, according to the manufacturer’s instructions. For total RNA isolated from serum, 10 μL of 0.05 μmol/L synthetic C. elegans miR-39 (GenePharma, Shanghai, China) was added to each sample after the samples were treated with TRIzol LS reagent. Finally, total RNA was resuspended in 45 μL of pre-heated (65 °C) nuclease-free water and analyzed using Nanodrop1000 (Thermo, MA, United States).
Reverse transcription was performed using the PrimeScript RT reagent Kit (TaKaRa, Dalian, China) according to the manufacturer’s instructions. One microgram of total RNA (10 μL) was used for a reverse transcription system containing 4 μL 5 × reverse transcription buffer, 4 μL nuclease-free H2O, 1 μL prime RT enzyme, and 1 μL RT primer. Quantitative PCR assay was conducted using the Permix Ex Taq Kit (TaKaRa) according to the manufacturer’s protocols. Two microliters of cDNA was used in a qPCR system containing 10 μL SYBR Premix Ex Taq II, 0.5 μL ROX Reference Dye II, 0.5 μL reverse primer, 0.5 μL forward primer, and 6.5 μL nuclease-free H2O. Running parameters of qPCR were: 95 °C for 2 min, followed by 40 cycles of 95 °C for 15 s and 58 °C for 30 s. Melt curves were collected over a range of temperatures from 58 °C to 95 °C, with an increase of 0.5 °C per 5 s. Primer sequences are showed in Table 2.
| mRNA | Sequence |
| β-actin forward | 5’-TGTCCACCTTCCAGCAGATGT-3’ |
| β-actin reverse | 5’-TGTCACCTTCACCGTTCCAGTT-3’ |
| IFNAR1 forward | 5’-TGGTGACAGCGTGAGACTCTT-3’ |
| IFNAR1 reverse | 5’-GCAGTAGCCAGCAGCATCAG-3’ |
| MiR-93-5p forward | 5′- GCCGCCAAAGTGCTGTTC-3′ |
| MiR-93-5p reverse | 5′-CAGAGCAGGGTCCGAGGTA-3′ |
| U6 forward | 5′-CAGCACATATACTAAAATTGGAACG-3′ |
| U6 reverse | 5′-ACGAATTTGCGTGTCATCC-3′ |
The expression of miR-93-5p and IFNAR1 in Huh7 cells was normalized using the 2-ΔΔCt method, with RNU6B and β-actin used as the references, respectively. Serum miR-93-5p concentration was calculated using a standard curve established by the synthetic miR-93-5p. The standard linearity of miR-93-5p quantification was generated in each qPCR reaction. Experimental qRT-PCR data were normalized using the synthetic C. elegans miR-39 as described previously[16].
DNA oligonucleotides that encode HCV core protein or Homo sapiens IFNAR1 protein were synthesized with flanking Spe I and Hind III restriction enzyme digestion sites. The synthesized DNA was inserted into pcDNA3.1 (+) vector (Addgene, United States) using T4 DNA Ligase according to the manufacturer’s instructions. DNA oligonucleotides containing wild-type or mutant 3’-untranslated region (UTR) of IFNAR1 were synthesized with flanking Spe I and Hind III restriction enzyme digestion sites, respectively, and the synthesized DNA was inserted into psiCHECKTM-2 vector (Promega, Wisconsin, United States). The sequences of the synthesized DNA are showed in Table 2.
The gain- or loss-of-function of miR-93-5p was performed using miR-93-5p agomir (RIBOBIO, Guangzhou, China) or antagomir (RIBOBIO), respectively. Lipofectamine 2000 (Invitrogen) was used for oligonucleotide transfection according to the manufacturer’s instruction.
HEK293T cells were cultured in 6-well plates and the cells in each well were transfected with 200 ng wild-type psiCHECK-IFNAR1-3’-UTR or 200 ng mutant psiCHECK-IFNAR1-3’-UTR, and then miR-93-5p agomir (200 nmol/L) or antagomir (200 nmol/L) was transfected into the cells using lipofectamine 2000, respectively. Twenty-four hours after transfection, the cells were collected and lysed using the luciferase reporter assay system according to the manufacturer’s instructions, followed by detection of fluorescence activity using GloMax 20/20 Luminometer.
Total protein from tissues and cells was extracted using the RIPA Lysis and Extraction Buffer (Thermo) according to the manufacturer’s instructions. Western blot assay was performed according to the standard protocol. Briefly, total proteins were separated using 8% or 10% SDS-PAGE gels, followed by transfer onto PVDF membranes. Skim milk (5%) or bovine serum albumin solution (used for p-STAT1 antibody) was used to block the PVDF membranes. Anti-IFNAR1 (Abcam, Cambridge, United Kingdom), anti-STAT1 (Cell Signaling Technology, Boston, United States), anti-p-STAT1 (Cell Signaling Technology), and anti-GAPDH (Cell Signaling Technology) antibodies were used to incubate the PVDF membranes overnight. Then, a horseradish peroxidase-conjugated secondary antibody (Zhongshan Biotechnology, Beijing, China) was used to incubate the PVDF membranes for 1 h. The PVDF membranes were washed using 1 × TBST solution three times and visualized using the SuperSignal West Dura Extended Duration Substrate kit (Thermo).
All data are presented as mean ± SD. The difference between two groups was analyzed using the Mann-Whitney test or the two-tailed Student’s t-test. One-way ANOVA was used for three or more groups. The relationship between the expression of miR-93-5p and IFNAR1 mRNA was evaluated using the Pearson’s correlation. A P-value < 0.05 was considered statistically significant. All statistical analyses and the generation of graphs were performed using GraphPad Prism 6.0 (Graphpad Software Inc, California, United Kingdom).
MiR-93-5p has been shown to be overexpressed in HCV-infected HCC tissues[14]. To determine whether miR-93-5p expression is also increased in serum of HCV-infected patients, we collected 168 serum samples, including 84 samples from 84 patients with HCV-1b infection before pegylated IFNα treatment and 84 samples from the same patients after pegylated IFNα treatment for 24 wk. PCR finally confirmed that 34 patients had pegylated IFNα resistance and 50 patients had pegylated IFNα sensitivity.
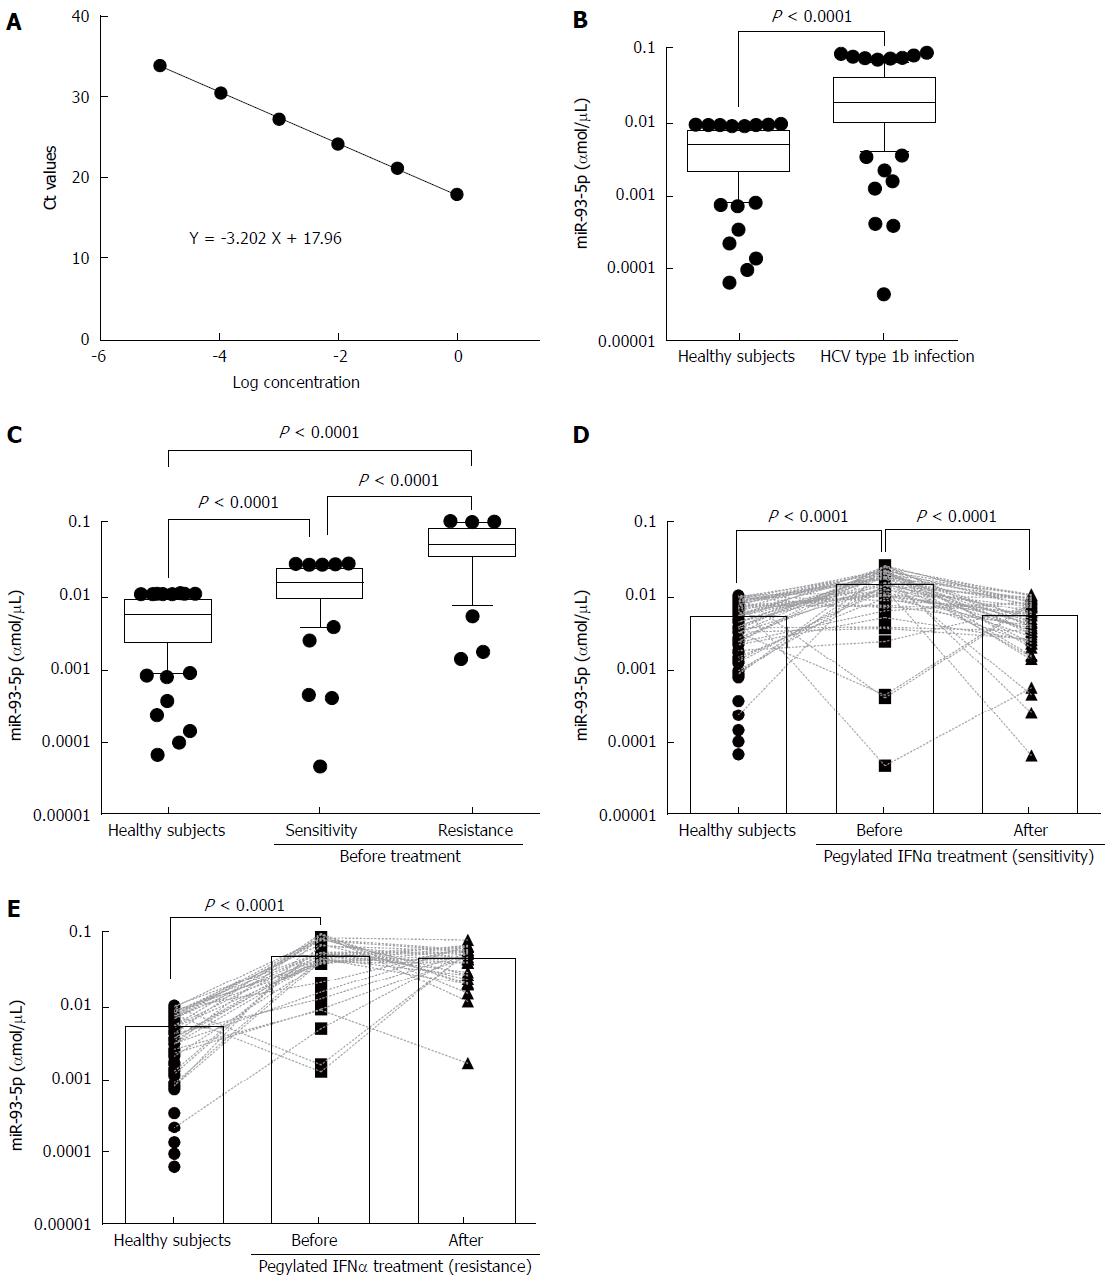
To measure serum miR-93-5p concentration, we established a dynamic range of miR-93-5p quantification. The synthetic single-strand miR-93-5p was serially diluted by 10-fold from concentrations of 1 to 0.00001 fmol, and qRT-PCR experiments showed the linearity of miR-93-5p quantification (Figure 1A). For the samples before pegylated IFNα treatment, serum miR-93-5p expression was significantly increased in HCV-1b-infected patients compared with healthy subjects (P < 0.0001) (Figure 1B), and it was also increased in the patients with pegylated IFNα sensitivity compared with healthy subjects (P = 0.0100). Interestingly, serum miR-93-5p expression was higher in patients with pegylated IFNα resistance than in those with pegylated IFNα sensitivity (P < 0.0001) (Figure 1C). For the samples after pegylated IFNα treatment, serum miR-93-5p expression was persistently increased in patients with pegylated IFNα resistance (P < 0.0001) (Figure 1D), but it was decreased in patients with pegylated IFNα sensitivity, similar to that in healthy subjects (Figure 1E). These data suggest that high level of miR-93-5p in serum is involved in HCV-1b infection and pegylated IFNα resistance.
Serum miR-93-5p in patients with HCV-1b infection is involved in pegylated IFNα resistance
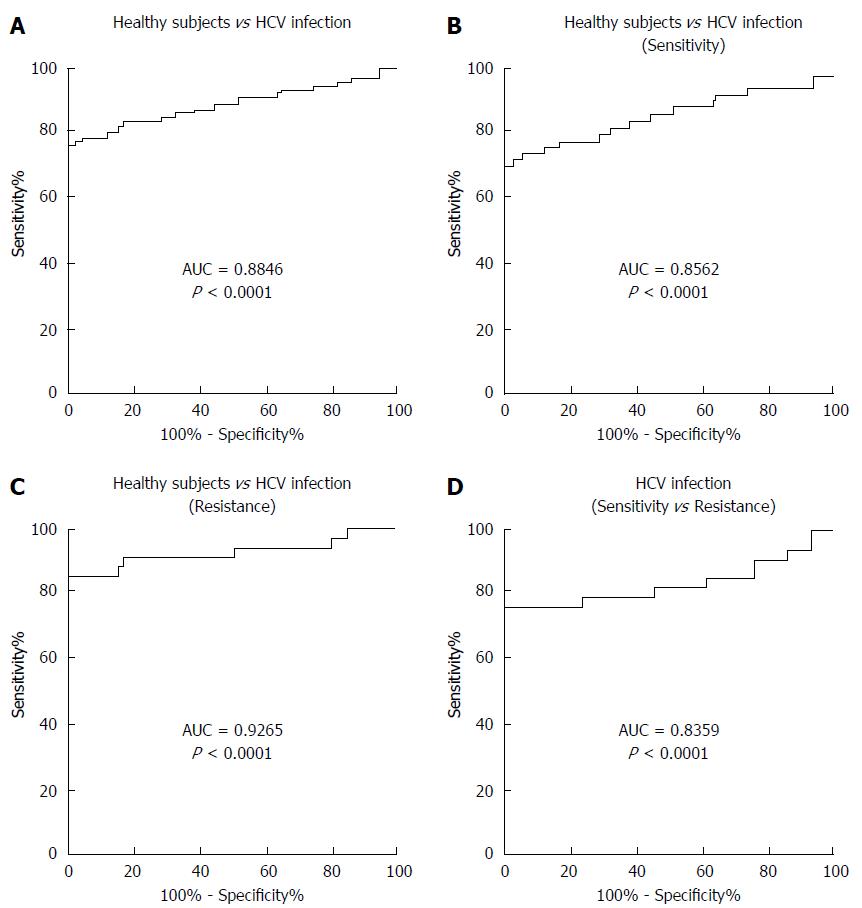
To determine whether serum miR-93-5p concentration can serve as a biomarker for predicting pegylated IFNα resistance, receiver operating characteristics (ROC) curve analysis was performed. The results showed an area under the curve (AUC) value of 0.8846 for serum miR-93-5p in distinguishing HCV-1b-infected patients from healthy subjects (Figure 2A), an AUC value of 0.8562 in distinguishing patients with pegylated IFNα sensitivity from healthy subjects (Figure 2B), an AUC value of 0.9265 in distinguishing patients with pegylated IFNα resistance from healthy subjects (Figure 2C), and an AUC value of 0.8359 in distinguishing patients with pegylated IFNα resistance from those with pegylated IFNαsensitivity (Figure 2D). The detailed information is showed in Table 3. These data suggest that serum miR-93-5p concentration may serve as a biomarker for pegylated IFNα resistance in HCV-1b-infected patients.
| AUC | Sensitivity | Specificity | Cut-off value (amol/μL) |
| 0.8846 (Infection vs Healthy) | 0.7619 | 1 | 0.009774 |
| 0.8562 (Sensitivity vs Healthy) | 0.7000 | 1 | 0.009774 |
| 0.9265 (Infection vs Resistance) | 0.8529 | 1 | 0.010870 |
| 0.8359 (Resistance vs Sensitivity) | 0.7647 | 1 | 0.030300 |
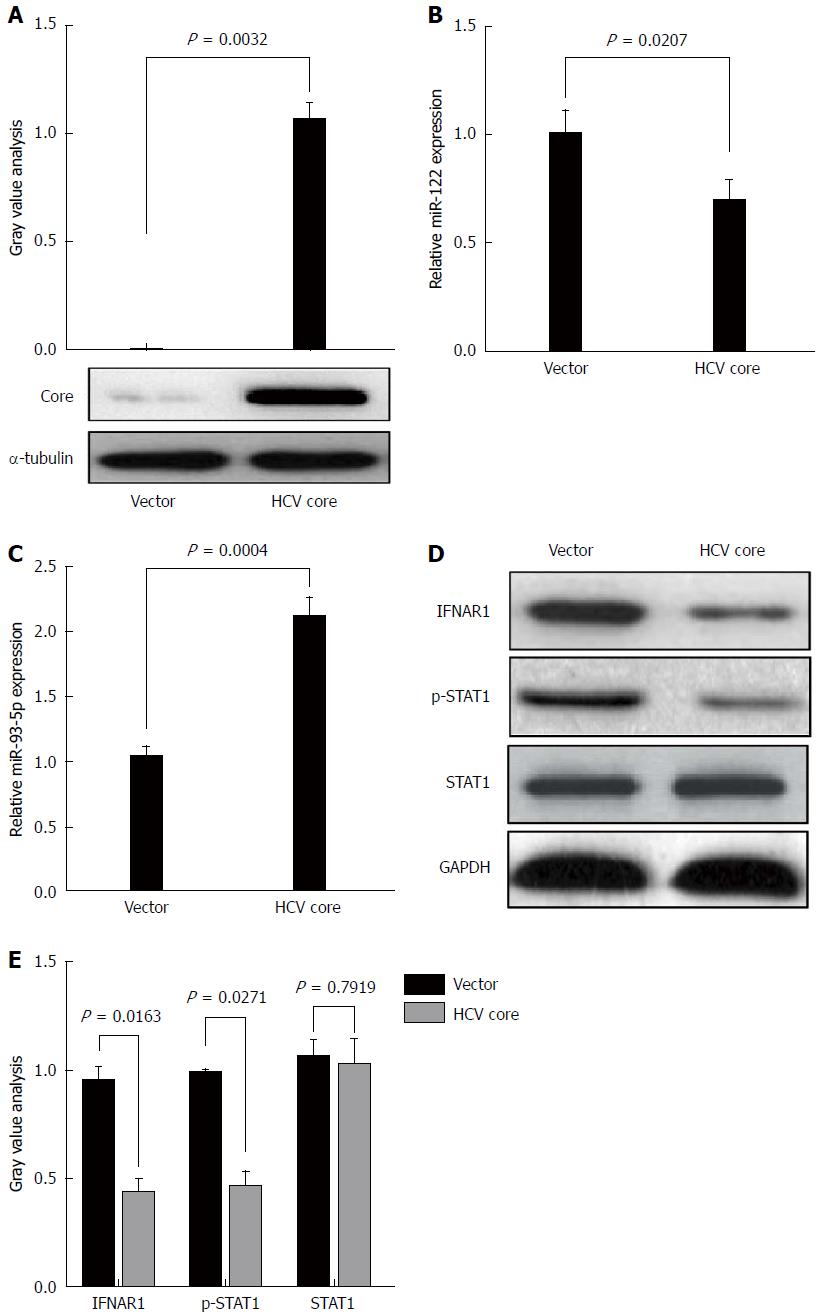
HCV core protein plays an important role in HCV infection. To determine whether HCV-1b infection could regulate miR-93-5p expression, HCV-1b core protein was enforcedly expressed in Huh7 cells (P = 0.0032) (Figure 3A). This approach was widely used in HCV studies due to its capability in supporting HCV replication. A previous study has shown that HCV-1b core protein decreased mature miR-122 expression[11]. Thus, we repeated these experiments and confirmed that HCV-1b core protein could reduce miR-122 expression (P = 0.0207) (Figure 3B), suggesting that exogenous HCV-1b core protein worked in Huh7 cells. Then, we found that HCV-1b core protein significantly increased miR-93-5p expression in Huh7 cells (P = 0.0004) (Figure 3C).
Although the treatment of pegylated IFN plus ribavirin was used, the sustained virological response (SVR) rate was around 50%-79% for HCV type 1/4 and 75%-94% for HCV type 2/3[17], suggesting that IFN-α resistance largely existed in HCV-1b infection. Thus, we speculated whether HCV-1b core protein could regulate the IFN signaling pathway. We initially measured the protein expression of IFNAR1 and STAT1, as well as the phosphorylation level of STAT1. As expected, our finding showed that HCV-1b core protein significantly decreased the protein expression of IFNAR1 and the phosphorylation level of STAT1, but the protein expression of STAT1 was not changed (Figure 3D and E). These data suggest that HCV-1b core protein induces inactivation of the IFN signaling pathway.
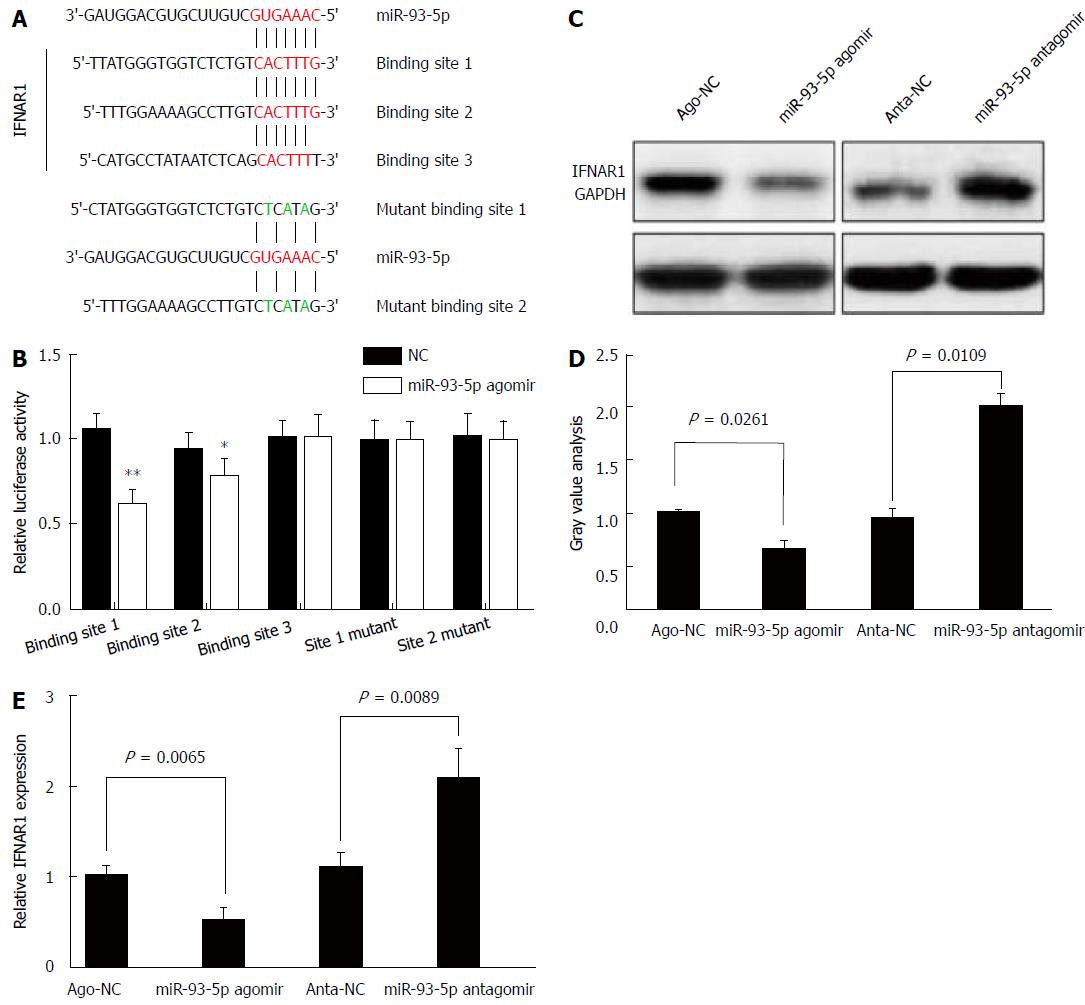
Next, we determined whether miR-93-5p is involved in HCV-1b core protein-induced inactivation of the IFN signaling pathway. As well known that miRNA exerting its function depends on its target, we used five databases (TargetScan, PicTar, RNA22, PITA, and MiRanda) to predict the targets of miR-93-5p, and found that IFNAR1 may be a potential target of miR-93-5p. IFNAR1 mRNA has three potential binding sites for miR-93-5p in the 3’-UTR. To confirm whether IFNAR1 is a target of miR-93-5p, we constructed the vectors containing wild-type 3’-UTR or mutant 3’-UTR of IFNAR1 mRNA using psiCHECK vector (Figure 4A). Luciferase assay revealed that miR-93-5p agomir significantly reduced the relative luciferase activity in the presence of binding site 1 (P < 0.0001) or 2 (P = 0.0173), rather than site 3. However, the relative luciferase activity had no significant change in the presence of the mutant binding sites, compared with NC (Figure 4B). Furthermore, miR-93-5p agomir also decreased the protein (P = 0.0261) and mRNA (P = 0.0065) expression of IFNAR1 in Huh7 cells compared with NC, while opposite results were found after miR-93-5p antagomir treatment (P = 0.0109, P = 0.0089) (Figure 4C-E). Together, these data suggest that IFNAR1 is a direct target of miR-93-5p.
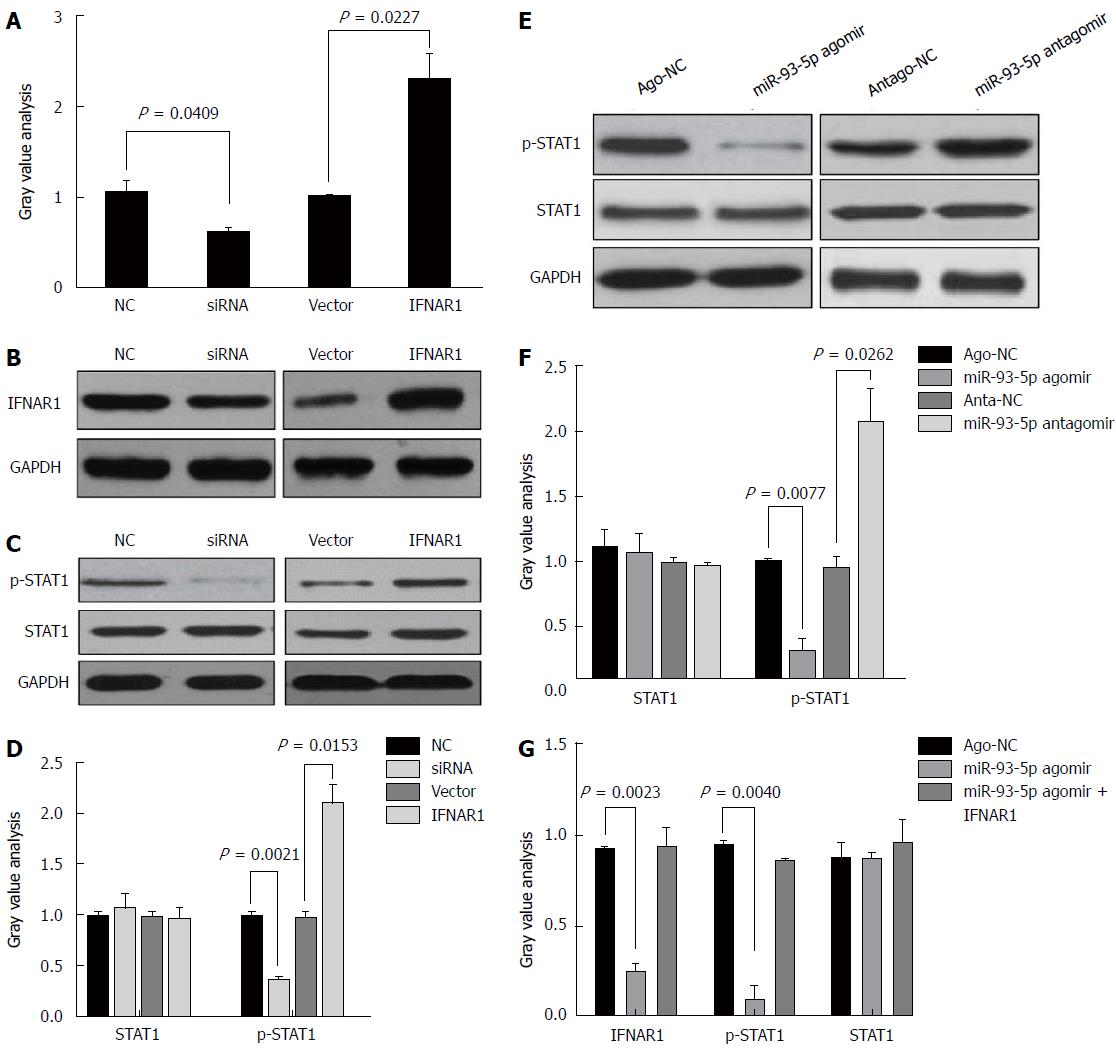
STAT1, a transcription factor, plays a crucial role in the IFN signaling pathway. Several studies have shown that IFNAR1 regulates the phosphorylation level of STAT1[18-20]. However, it is unclear whether the miR-93-5p-IFNAR1 axis could regulate the phosphorylation level of STAT1 in Huh7 cells. Thus, we induced the enforced expression or silencing of IFNAR1 in Huh7 cells using pcDNA3.1 (+) vectors and IFNAR1 siRNA, respectively (Figure 5A). Western blot analysis showed that IFNAR1 knockdown significantly decreased the phosphorylation level of STAT1 (P = 0.0021), but not the protein expression of STAT1, whereas IFNAR1 overexpression significantly increased the phosphorylation level of STAT1 (P = 0.0153) (Figure 5B and C). Furthermore, miR-93-5p agomir significantly decreased the phosphorylation level of STAT1 (P = 0.0077), whereas miR-93-5p inhibitors significantly increased it (P = 0.0262) (Figure 5D and E). To further confirm that the miR-93-5p-IFNAR1 axis could regulate STAT1 phosphorylation, a rescue assay was carried out. The results showed that IFNAR1 overexpression rescued miR-93-5p-induced decrease of STAT1 phosphorylation level in Huh7 cells (Figure 5F). These data suggest that the miR-93-5p-IFNAR1 axis regulates the STAT1 signaling pathway.
In the present study, we found that serum miR-93-5p expression was increased in patients with HCV-1b infection compared with healthy subjects, and was higher in HCV-1b-infected patients with pegylated IFNα resistance than in those with pegylated IFNα sensitivity. We also found that HCV-1b core protein could increase miR-93-5p expression and decrease IFNAR1 expression, and further identified that IFNAR1 is a direct target of miR-93-5p. Furthermore, our findings showed that the miR-93-5p-IFNAR1 axis could regulate STAT1 phosphorylation.
MiR-93-5p belongs to the miR-106-25 cluster which plays a crucial role in cancer development. Yen et al[14] found that three miRNAs in the miR-106-25 cluster were overexpressed in HCC tissues and their data suggested that miR-93-5p was upregulated in HCV-associated HCC tissues. In addition, miR-93-5p overexpression was also involved in HCV-positive cirrhosis[21]. In our study, we found that miR-93-5p overexpression was associated with pegylated IFNα resistance of HCV-1b, which is the most prevalent type of HCV in China and highly resists to IFNα treatment. HCV core protein, an important component of HCV, promoted the dysregulation of miRNAs, such as miR-122[11]. However, whether HCV core protein regulates miR-93-5p expression remains largely unclear. Our findings demonstrated that HCV core protein increased miR-93-5p expression in Huh7 cells.
Ohta et al[15] demonstrated that miR-93 directly targets PTEN and CDKN1A, thereby activating proliferation and inhibiting apoptosis through the c-Met/PI3K/Akt pathway. In our study, we integrated five databases to find and further confirm that IFNAR1, a receptor of IFNα and IFNβ, is a potential target of miR-93-5p, implying that miR-93-5p has multiple targets in hepatocytes, but our data suggested that the miR-93-5p-IFNAR1 axis might be mainly involved in HCV-1b infection. Recently, Ma et al[22] showed that the miR-93-5p/IFNAR1 axis promotes gastric cancer metastasis by activating the STAT3 signaling pathway. These data strongly support our finding that IFNAR1 is a target of miR-93-5p in hepatocyte cells. We believe that similar mechanism in different types of cells may play different roles. As well known that IFNAR1 plays a crucial role in the IFN signaling pathway, our study then confirmed that the miR-93-5p-IFNAR1 axis regulates the phosphorylation level of STAT1, which is an important transcription factor in the IFN signaling pathway. Zhao et al[23] have confirmed that IFNAR mediates the IFN-α-triggered STAT signaling pathway, and inhibition of this pathway could increase HCV RNA replication. These data strongly support our finding that the miR-93-5p-IFNAR1 axis regulates STAT1 phosphorylation and thereby affects the therapeutic effect of pegylated IFNα.
In addition, HCV infection could reduce the protein expression of STAT1 and STAT3 by promoting proteasomal degradation[24], but our data revealed that HCV-1b infection could regulate STAT1 phosphorylation via the miR-93-5p-IFNAR1 axis. Although we identified the role and mechanism of miR-93-5p in regulating the IFN signaling pathway in Huh7 cells, an in vivo study needs to be performed in the future.
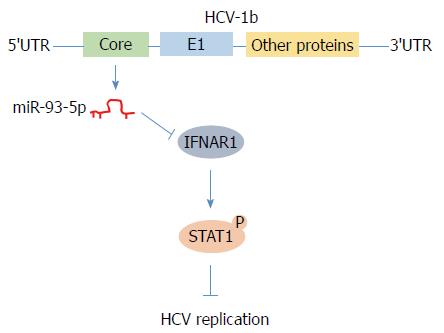
In conclusion, we found that HCV-1b core protein increased miR-93-5p expression and identified that IFNAR1 is a direct target of miR-93-5p. Moreover, the miR-93-5p-IFNAR1 axis regulated STAT1 phosphorylation, suggesting that this axis might be a novel therapeutic target for HCV-1b infection (Figure 6).
Hepatitis C virus (HCV)-1b core protein is an important component of HCV and plays a crucial role in HCV infection and pegylated IFNα resistance, but the mechanism underlying HCV core protein-induced pegylated IFNα resistance remains unclear.
Our findings highlight the mechanism that HCV-1b core protein induces pegylated IFNα resistance via regulating the miR-93-5p-interferon receptor 1 (IFNAR1) axis. This axis may be a potential therapeutic target for HCV-1b treatment.
The objective of this study was to elucidate why HCV-1b causes pegylated IFNα resistance. It is partially realized and provides a clue for drug design of HCV-1b treatment.
The research methods included cell culture, RNA extraction, qRT-PCR, vector construct, oligonucleotide transfection, luciferase assay, and Western blot. Data analysis was performed using multiple statistical methods that include the Mann-Whitney test, two-tailed Student’s t-test, one-way ANOVA, and Pearson’s correlation. Eighty-four patients with HCV-1b infection and 84 healthy subjects were enrolled in this study.
This study found that serum miR-93-5p expression was increased in patients with HCV-1b infection and HCV-1b core protein increased miR-93-5p expression, identified that IFNAR1 is a target of miR-93-5p, and further demonstrated that the miR-93-5p-IFNAR1 axis regulated the IFN signaling pathway.
This study found that HCV-1b increases miR-93-5p expression, IFNAR1 is a target of miR-93-5p in hepatocyte, and miR-93-5p-IFNAR1 axis regulates the IFN signaling pathway. This study also provided some evidence that HCV-1b induces pegylated IFNα resistance by regulating the miR-93-5p-IFNAR1 axis, suggesting that the miR-93-5p-IFNAR1 axis might be a potential therapeutic target for HCV-1b infection.
This study demonstrated the mechanism by which miR-93-5p inhibits the IFN signaling pathway in vitro, but an in vitro study needs to be performed in the future. The design of siRNAs which exclusively destroy the miR-93-5p-IFNAR1 axis may be important for improving the therapeutic effect of pegylated IFNα.
Manuscript source: Unsolicited manuscript
Specialty type: Gastroenterology and hepatology
Country of origin: China
Peer-review report classification
Grade A (Excellent): 0
Grade B (Very good): B
Grade C (Good): C
Grade D (Fair): 0
Grade E (Poor): 0
P- Reviewer: Kocazeybek B, Watanabe T S- Editor: Chen K L- Editor: Wang TQ E- Editor: Li RF
| 1. | Thomas DL. Global control of hepatitis C: where challenge meets opportunity. Nat Med. 2013;19:850-858. [PubMed] [DOI] [Cited in This Article: ] [Cited by in F6Publishing: 1] [Reference Citation Analysis (0)] |
| 2. | Dubuisson J, Cosset FL. Virology and cell biology of the hepatitis C virus life cycle: an update. J Hepatol. 2014;61:S3-S13. [PubMed] [DOI] [Cited in This Article: ] [Cited by in Crossref: 131] [Cited by in F6Publishing: 126] [Article Influence: 12.6] [Reference Citation Analysis (0)] |
| 3. | Horsley-Silva JL, Vargas HE. New Therapies for Hepatitis C Virus Infection. Gastroenterol Hepatol (NY). 2017;13:22-31. [PubMed] [Cited in This Article: ] |
| 4. | Manns MP, McHutchison JG, Gordon SC, Rustgi VK, Shiffman M, Reindollar R, Goodman ZD, Koury K, Ling M, Albrecht JK. Peginterferon alfa-2b plus ribavirin compared with interferon alfa-2b plus ribavirin for initial treatment of chronic hepatitis C: a randomised trial. Lancet. 2001;358:958-965. [PubMed] [DOI] [Cited in This Article: ] [Cited by in Crossref: 4736] [Cited by in F6Publishing: 4508] [Article Influence: 196.0] [Reference Citation Analysis (0)] |
| 5. | Palisoc AM, Fayad J, Singh AK, Farnham IM. Induction therapy of interferon alfa-2b in combination with ribavirin as initial treatment for chronic hepatitis C genotype 1: A pilot study. Am J Gastroenterol. 2006;101:S164-S164. [Cited in This Article: ] |
| 6. | Ascione A, De Luca M, Tartaglione MT, Lampasi F, Di Costanzo GG, Lanza AG, Picciotto FP, Marino-Marsilia G, Fontanella L, Leandro G. Peginterferon alfa-2a plus ribavirin is more effective than peginterferon alfa-2b plus ribavirin for treating chronic hepatitis C virus infection. Gastroenterology. 2010;138:116-122. [PubMed] [DOI] [Cited in This Article: ] [Cited by in Crossref: 128] [Cited by in F6Publishing: 137] [Article Influence: 9.8] [Reference Citation Analysis (0)] |
| 7. | Pawlotsky JM. New hepatitis C therapies: the toolbox, strategies, and challenges. Gastroenterology. 2014;146:1176-1192. [PubMed] [DOI] [Cited in This Article: ] [Cited by in Crossref: 418] [Cited by in F6Publishing: 428] [Article Influence: 42.8] [Reference Citation Analysis (0)] |
| 8. | Lindow M, Kauppinen S. Discovering the first microRNA-targeted drug. J Cell Biol. 2012;199:407-412. [PubMed] [DOI] [Cited in This Article: ] [Cited by in Crossref: 209] [Cited by in F6Publishing: 207] [Article Influence: 18.8] [Reference Citation Analysis (0)] |
| 9. | Pedersen IM, Cheng G, Wieland S, Volinia S, Croce CM, Chisari FV, David M. Interferon modulation of cellular microRNAs as an antiviral mechanism. Nature. 2007;449:919-922. [PubMed] [DOI] [Cited in This Article: ] [Cited by in Crossref: 686] [Cited by in F6Publishing: 727] [Article Influence: 42.8] [Reference Citation Analysis (0)] |
| 10. | Boldanova T, Suslov A, Heim MH, Necsulea A. Transcriptional response to hepatitis C virus infection and interferon-alpha treatment in the human liver. EMBO Mol Med. 2017;9:816-834. [PubMed] [DOI] [Cited in This Article: ] [Cited by in Crossref: 38] [Cited by in F6Publishing: 40] [Article Influence: 6.7] [Reference Citation Analysis (0)] |
| 11. | Kim GW, Lee SH, Cho H, Kim M, Shin EC, Oh JW. Hepatitis C Virus Core Protein Promotes miR-122 Destabilization by Inhibiting GLD-2. PLoS Pathog. 2016;12:e1005714. [PubMed] [DOI] [Cited in This Article: ] [Cited by in Crossref: 19] [Cited by in F6Publishing: 20] [Article Influence: 2.5] [Reference Citation Analysis (0)] |
| 12. | Cheng M, Si Y, Niu Y, Liu X, Li X, Zhao J, Jin Q, Yang W. High-throughput profiling of alpha interferon- and interleukin-28B-regulated microRNAs and identification of let-7s with anti-hepatitis C virus activity by targeting IGF2BP1. J Virol. 2013;87:9707-9718. [PubMed] [DOI] [Cited in This Article: ] [Cited by in Crossref: 49] [Cited by in F6Publishing: 50] [Article Influence: 4.5] [Reference Citation Analysis (0)] |
| 13. | Singaravelu R, Russell RS, Tyrrell DL, Pezacki JP. Hepatitis C virus and microRNAs: miRed in a host of possibilities. Curr Opin Virol. 2014;7:1-10. [PubMed] [DOI] [Cited in This Article: ] [Cited by in Crossref: 27] [Cited by in F6Publishing: 27] [Article Influence: 2.7] [Reference Citation Analysis (0)] |
| 14. | Yen CS, Su ZR, Lee YP, Liu IT, Yen CJ. miR-106b promotes cancer progression in hepatitis B virus-associated hepatocellular carcinoma. World J Gastroenterol. 2016;22:5183-5192. [PubMed] [DOI] [Cited in This Article: ] [Cited by in CrossRef: 41] [Cited by in F6Publishing: 45] [Article Influence: 5.6] [Reference Citation Analysis (0)] |
| 15. | Ohta K, Hoshino H, Wang J, Ono S, Iida Y, Hata K, Huang SK, Colquhoun S, Hoon DS. MicroRNA-93 activates c-Met/PI3K/Akt pathway activity in hepatocellular carcinoma by directly inhibiting PTEN and CDKN1A. Oncotarget. 2015;6:3211-3224. [PubMed] [DOI] [Cited in This Article: ] [Cited by in Crossref: 126] [Cited by in F6Publishing: 131] [Article Influence: 14.6] [Reference Citation Analysis (0)] |
| 16. | Li BS, Zhao YL, Guo G, Li W, Zhu ED, Luo X, Mao XH, Zou QM, Yu PW, Zuo QF. Plasma microRNAs, miR-223, miR-21 and miR-218, as novel potential biomarkers for gastric cancer detection. PLoS One. 2012;7:e41629. [PubMed] [DOI] [Cited in This Article: ] [Cited by in Crossref: 152] [Cited by in F6Publishing: 184] [Article Influence: 15.3] [Reference Citation Analysis (0)] |
| 17. | Huang CF, Huang JF, Yang JF, Hsieh MY, Lin ZY, Chen SC, Wang LY, Juo SH, Chen KC, Chuang WL. Interleukin-28B genetic variants in identification of hepatitis C virus genotype 1 patients responding to 24 weeks peginterferon/ribavirin. J Hepatol. 2012;56:34-40. [PubMed] [DOI] [Cited in This Article: ] [Cited by in Crossref: 71] [Cited by in F6Publishing: 73] [Article Influence: 6.1] [Reference Citation Analysis (0)] |
| 18. | de Weerd NA, Matthews AY, Pattie PR, Bourke NM, Lim SS, Vivian JP, Rossjohn J, Hertzog PJ. A hot spot on interferon α/β receptor subunit 1 (IFNAR1) underpins its interaction with interferon-β and dictates signaling. J Biol Chem. 2017;292:7554-7565. [PubMed] [DOI] [Cited in This Article: ] [Cited by in Crossref: 16] [Cited by in F6Publishing: 16] [Article Influence: 2.3] [Reference Citation Analysis (0)] |
| 19. | Hurtado-Guerrero I, Pinto-Medel MJ, Urbaneja P, Rodriguez-Bada JL, León A, Guerrero M, Fernández Ó, Leyva L, Oliver-Martos B. Activation of the JAK-STAT Signaling Pathway after In Vitro Stimulation with IFNß in Multiple Sclerosis Patients According to the Therapeutic Response to IFNß. PLoS One. 2017;12:e0170031. [PubMed] [DOI] [Cited in This Article: ] [Cited by in Crossref: 14] [Cited by in F6Publishing: 14] [Article Influence: 2.0] [Reference Citation Analysis (0)] |
| 20. | Chmiest D, Sharma N, Zanin N, Viaris de Lesegno C, Shafaq-Zadah M, Sibut V, Dingli F, Hupé P, Wilmes S, Piehler J. Spatiotemporal control of interferon-induced JAK/STAT signalling and gene transcription by the retromer complex. Nat Commun. 2016;7:13476. [PubMed] [DOI] [Cited in This Article: ] [Cited by in Crossref: 49] [Cited by in F6Publishing: 43] [Article Influence: 5.4] [Reference Citation Analysis (0)] |
| 21. | Oksuz Z, Serin MS, Kaplan E, Dogen A, Tezcan S, Aslan G, Emekdas G, Sezgin O, Altintas E, Tiftik EN. Serum microRNAs; miR-30c-5p, miR-223-3p, miR-302c-3p and miR-17-5p could be used as novel non-invasive biomarkers for HCV-positive cirrhosis and hepatocellular carcinoma. Mol Biol Rep. 2015;42:713-720. [PubMed] [DOI] [Cited in This Article: ] [Cited by in Crossref: 61] [Cited by in F6Publishing: 70] [Article Influence: 7.0] [Reference Citation Analysis (0)] |
| 22. | Ma DH, Li BS, Liu JJ, Xiao YF, Yong X, Wang SM, Wu YY, Zhu HB, Wang DX, Yang SM. miR-93-5p/IFNAR1 axis promotes gastric cancer metastasis through activating the STAT3 signaling pathway. Cancer Lett. 2017;408:23-32. [PubMed] [DOI] [Cited in This Article: ] [Cited by in Crossref: 45] [Cited by in F6Publishing: 57] [Article Influence: 8.1] [Reference Citation Analysis (0)] |
| 23. | Zhao LJ, He SF, Liu Y, Zhao P, Bian ZQ, Qi ZT. Inhibition of STAT Pathway Impairs Anti-Hepatitis C Virus Effect of Interferon Alpha. Cell Physiol Biochem. 2016;40:77-90. [PubMed] [DOI] [Cited in This Article: ] [Cited by in Crossref: 10] [Cited by in F6Publishing: 10] [Article Influence: 1.3] [Reference Citation Analysis (0)] |
| 24. | Stevenson NJ, Bourke NM, Ryan EJ, Binder M, Fanning L, Johnston JA, Hegarty JE, Long A, O’Farrelly C. Hepatitis C virus targets the interferon-α JAK/STAT pathway by promoting proteasomal degradation in immune cells and hepatocytes. FEBS Lett. 2013;587:1571-1578. [PubMed] [DOI] [Cited in This Article: ] [Cited by in Crossref: 38] [Cited by in F6Publishing: 35] [Article Influence: 3.2] [Reference Citation Analysis (0)] |


