Copyright
©The Author(s) 2018.
World J Gastroenterol. May 14, 2018; 24(18): 1995-2008
Published online May 14, 2018. doi: 10.3748/wjg.v24.i18.1995
Published online May 14, 2018. doi: 10.3748/wjg.v24.i18.1995
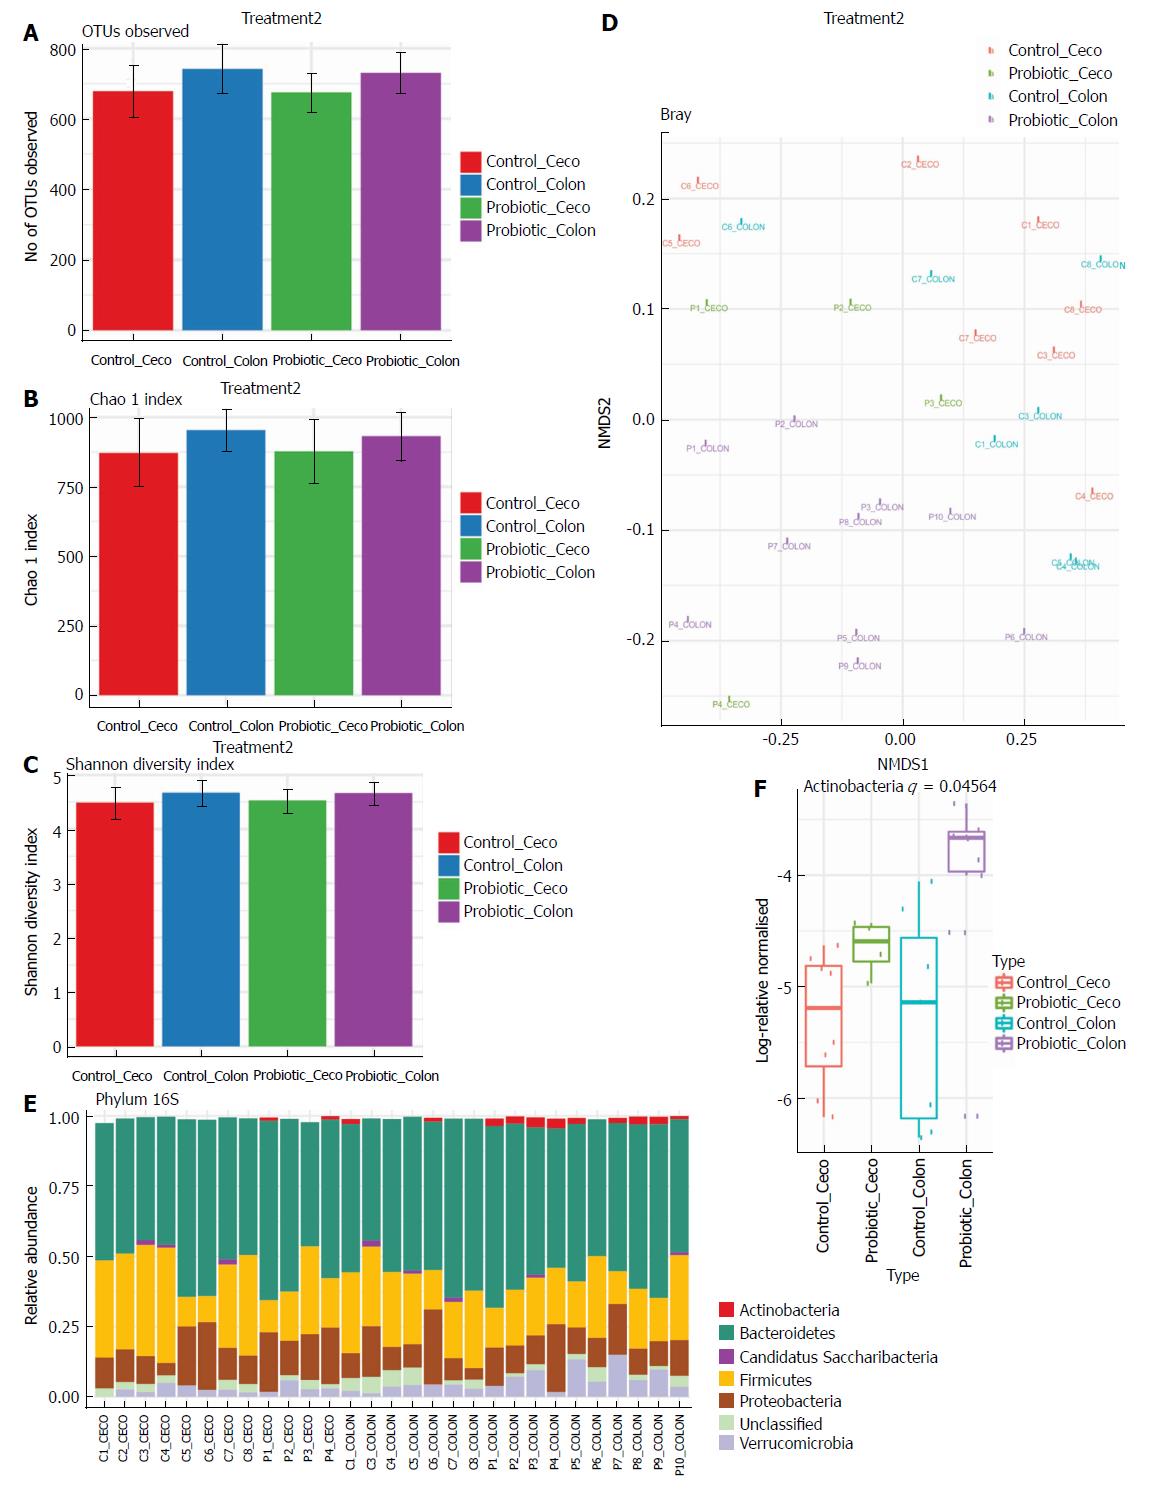
Figure 2 Probiotic supplementation changes the intestinal microbiota composition.
A-C: Microbiota alpha-diversity in the faecal content of the cecum and colon from control and probiotic groups. Differences and comparisons of species richness (A), total number of operational taxonomic units, (B) Chao1 Richness Index, (C) Shannon Diversity Index. Data are expressed as means ± SEM. Control cecum, n = 8; Probiotic cecum, n = 4; Control colon, n = 7; Probiotic colon, n = 10, Kruskal-Wallis test. D: Non-metric multidimensional scaling (nMDS) analysis of colon and cecum faecal content from control and probiotic-treated animals. Each point represents a sample, groups identified by coloration, according to legend. E, F. Relative abundance at the phylum level in the cecum and colon from control and treated with probiotic Groups. E: Each bar represents an individual animal, the colour of each cell indicates the relative abundance of bacterial phyla. Taxa with relative abundance greater than 1% are shown. F: Box-plot represents log relative normalized abundance at the phylum level in the cecum and colon from control and probiotic-treated groups. ‘C’ for Control and ‘P’ for Probiotic. Only the significant P values obtained by the Kruskal-Wallis test are shown as q value.
- Citation: Mendes MCS, Paulino DS, Brambilla SR, Camargo JA, Persinoti GF, Carvalheira JBC. Microbiota modification by probiotic supplementation reduces colitis associated colon cancer in mice. World J Gastroenterol 2018; 24(18): 1995-2008
- URL: https://www.wjgnet.com/1007-9327/full/v24/i18/1995.htm
- DOI: https://dx.doi.org/10.3748/wjg.v24.i18.1995


